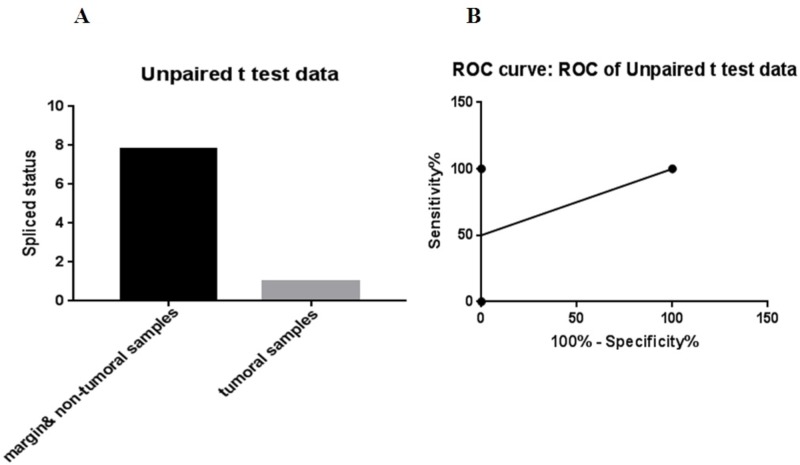
Figure 5. A: Comparison of the number of tumor samples that XBP gene spliced opposed to non-tumor samples, B: ROC analysis of this comparison (cut off<4.4; 95% CI, 2.5% to 100%, specificity and sensitivity: 100%) using GraphPad Prism software version 7.0.
ROC: receiver operating characteristic; CI: confidence interval; XBP: X-box binding protein

