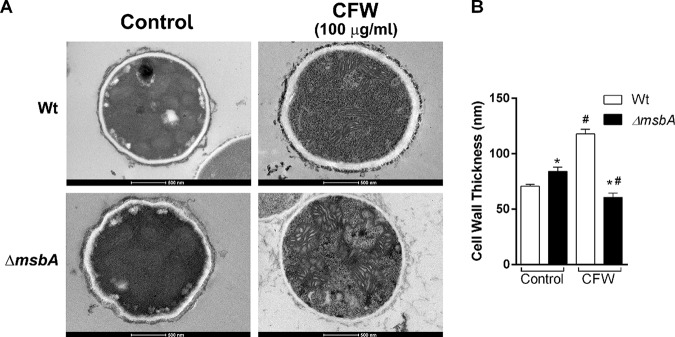
FIG 5.
The ΔmsbA strain has altered cell wall thickness. (A) Transmission electronic microscopy images of hyphae from wild-type and ΔmsbA strains grown in liquid MM with or without CFW (100 μg/ml). Bars, 500 nm. (B) Cell wall thickness was quantified under each condition. Values are shown as mean ± SEM from 50 different sections. Asterisk represents statistical difference (P < 0.05) compared with wild type under the same growth condition. Number sign represents statistical difference (P < 0.05) compared within the group (wild type × wild type/ΔmsbA strain × ΔmsbA strain) under control condition.

