Figure 6.

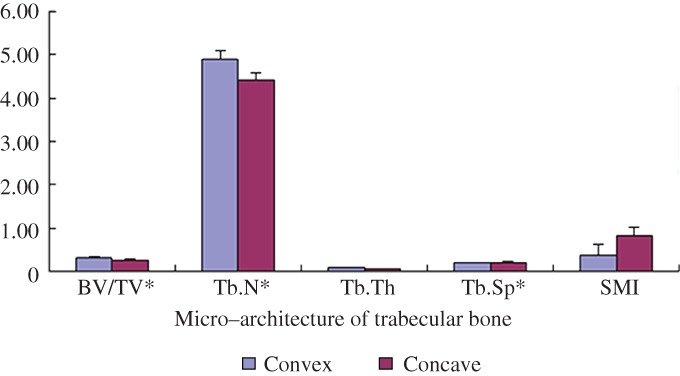
The column chart shows the micro‐architecture of the apical vertebra trabecular bones. Numerical value was shown to describe the bone quality of the apical vertebra on convex and concave sides. All values are shown as mean ± SD. *P < 0.05.

The column chart shows the micro‐architecture of the apical vertebra trabecular bones. Numerical value was shown to describe the bone quality of the apical vertebra on convex and concave sides. All values are shown as mean ± SD. *P < 0.05.