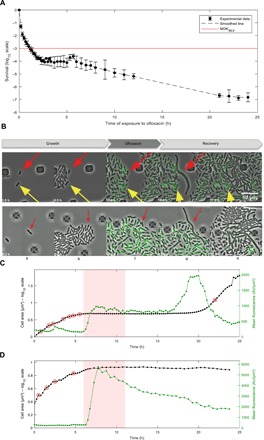
Fig. 1. Single-cell imaging of persister and nonpersister cells to ofloxacin.

(A) Time-kill curve of MG1655 strain. Batch cultures were performed in similar conditions to microfluidic experiments. The MG1655 strain was grown in MOPS-based medium supplemented with 0.4% glucose and then challenged with ofloxacin (final concentration of 5 μg/ml). Survival was monitored at indicated times as described in the Materials and Methods. Data points are mean values of nine independent experiments, and error bars represent SDs. The red line represents the MDK99.9 (minimum duration for killing 99.9% of the population). (B) Fluorescence microscopy snapshots of the MG1655 strain containing the psulA::gfp reporter plasmid during time-lapse microscopy in the microfluidic chamber. Top panels show a persister cell that did not divide during the 7-hour growth phase in the microfluidic chamber after inoculation with an overnight culture (red arrow) and a nongrowing cell that is not a persister cell (yellow arrow). Bottom panels represent the persister p2 that was dividing after inoculation of the microfluidic chamber with an exponentially growing culture (red arrow). Time is indicated at the bottom-left corner of each picture. (C and D) Life cycle of persister p2 (C) and nonpersister cell np8 (D). The cumulated area (log10 scale) and the mean fluorescence of persister cell p2 and nonpersister cell np8 are plotted as a function of time. Red circles indicate cell division events before the addition of ofloxacin (5 μg/ml) and the first cell division event during the recovery phase (C). Red shaded area indicates ofloxacin treatment.
