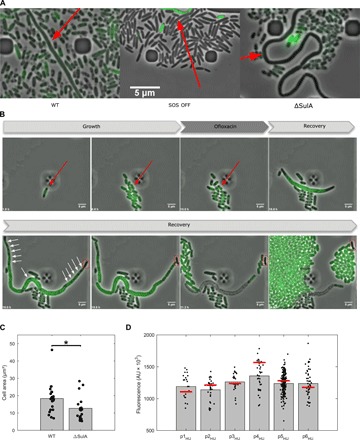
Fig. 4. Characterization of persister filaments.

(A) Persister cells filamentation does not solely rely on the SOS response. Fluorescence microscopy snapshots of persister filaments of the wild-type strain (left), the SOS OFF mutant (middle), and the ΔSulA mutant (right) during recovery in microfluidic time-lapse experiments are shown. The different strains contain the psulA::gfp reporter plasmid. Persister filaments are indicated by a red arrow. (B) Persister cells form polynucleated filaments during recovery. Fluorescent microscopy snapshots of the MG1655 strain containing the hupA::gfp reporter during time-lapse experiments in the microfluidic chamber are shown. The red arrow indicates a persister cell during the growth and treatment phases. White arrows indicate DNA-free regions separating well-segregated nucleoids within the filament. A DNA-free pole of the persister filament is boxed in red. Time at which pictures were taken is indicated at the bottom-left corner of each image. (C) Persister filament maximal area is slightly decreased in a ΔSulA mutant during recovery. The maximal area (μm²) of persister filaments was monitored for the MG1655 wild-type strain and the isogenic ΔSulA mutant. Bar graphs represent mean values, and values for all persister cells are plotted as dots. A Student’s t-test was performed between data for the wild-type strain and the ΔSulA mutant (*P < 0.05). (D) Persister cells do not contain reduced levels of DNA before the ofloxacin treatment. Fluorescence of the MG1655 wild-type strain containing the HU-GFP reporter plasmid is represented for persister (bars) and nonpersister cells (black dots) within a same microcolony immediately before ofloxacin treatment during time-lapse microscopy in the microfluidic chamber. The number of cells within every microcolony is n = 25 (p1HU), n = 31 (p2HU), n = 24 (p3HU), n = 38 (p4HU), n = 188 (p5HU), and n = 52 (p6HU).
