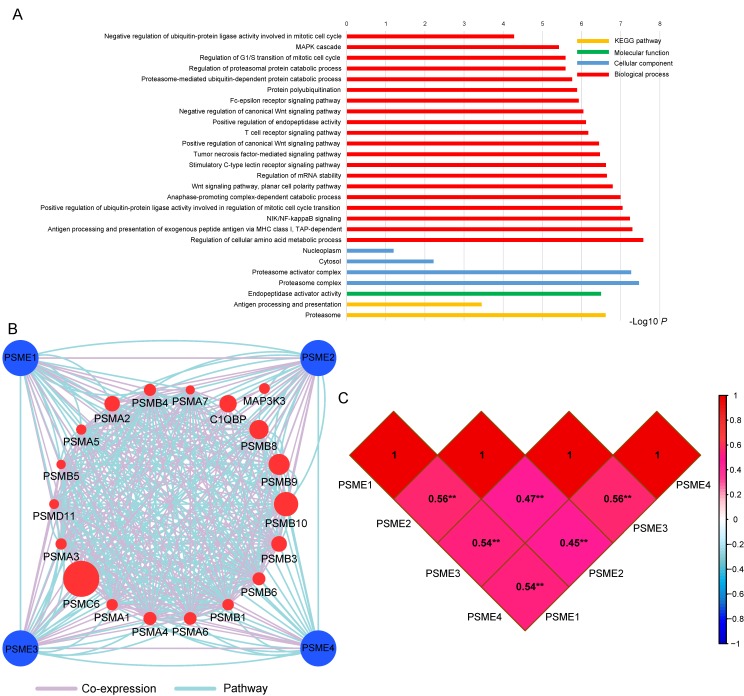
Figure 2.
(A) GO enrichment and KEGG pathway analysis by DAVID; (B) Gene interaction networks among selected genes by GeneMANIA; (C) Pearson's correlation coefficients between PSME1, PSME2 and PSME3 expression levels; and **P<0.001. Abbreviations: PSME, proteasome activator subunit; TCGA, The Cancer Genome Atlas; GeneMANIA, gene multiple association network integration algorithm; DAVID, the database for annotation, visualization, and integrated discovery; GO, gene ontology; KEGG, Kyoto encyclopedia of genes and genomes.

