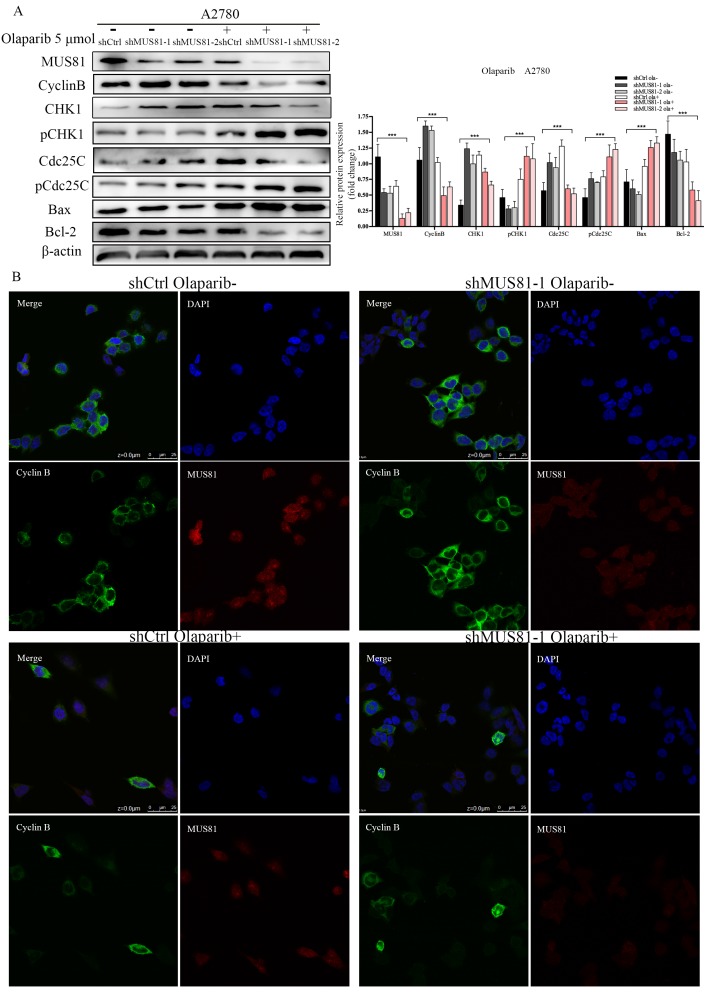
Figure 6.
The effect of Olaparib on protein expression. (A) Western blot analysis of MUS81 and CyclinB pathway member expression levels in A2780 cells after treatment with 5 μmol/l Olaparib compared to that of a blank control. β-actin was used as the loading control. The bars (fold change) represent the relative expression of the target protein relative to β-actin. (B) Confocal microscopy revealed the localization of the MUS81 and CyclinB proteins in the shCtrl and shMUS81-1 cells of A2780 cell lines.

