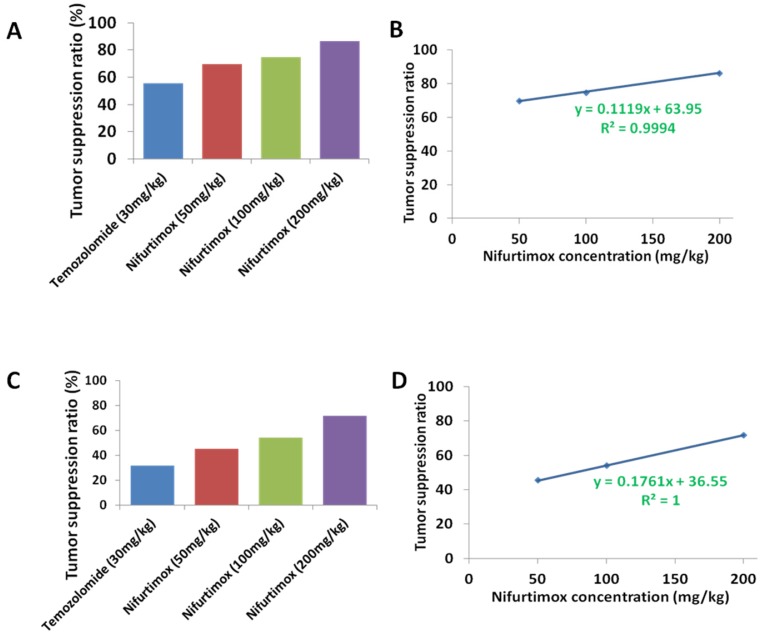
Figure 5.
The tumor suppression ratio correlated with the dosage of the Nifurtimox. A and C) the tumor suppression ratio was calculated according to either the tumor-fluorescence intensity or the kidney weight with that of their control. B and D) The obtained tumor suppression ratio correlated perfectly with the dosage of Nifurtimox, R2= 0.9994 or, R2= 1.

