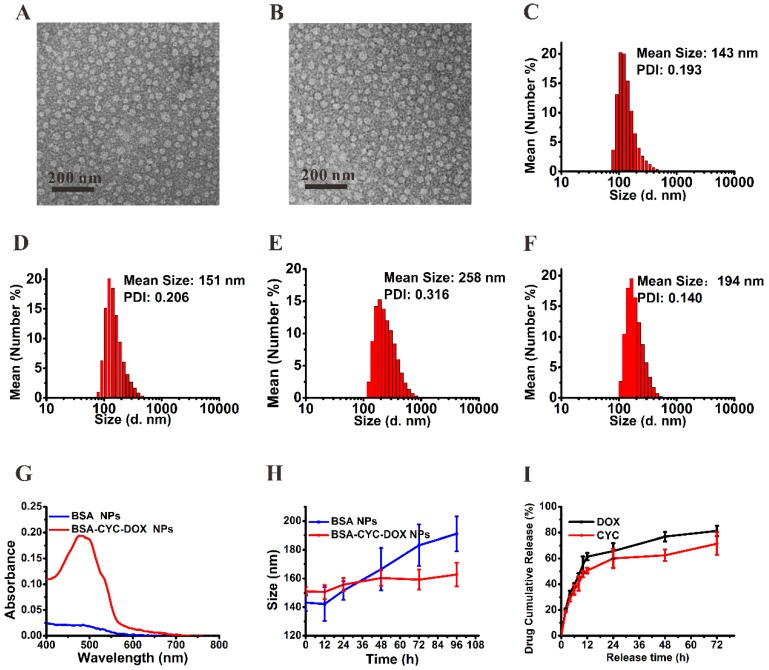
Figure 1.
Characterization of BSA NPs and BSA-CYC-DOX NPs. (a-d). Morphology and size distribution measured by TEM and DLS (a, c: BSA NPs. b, d: BSA-CYC-DOX NPs). (e-f). Size distribution of the BSA NPs (e) and BSA-CYC-DOX NPs (f) redissolved in PBS after lyophilization. (g). UV-visible spectra of BSA NPs and BSA-CYC-DOX NPs. (h). Stability of BSA NPs and BSA-CYC-DOX NPs in PBS containing 10% FBS. (i). In vitro drug release of BSA-CYC-DOX NPs.

