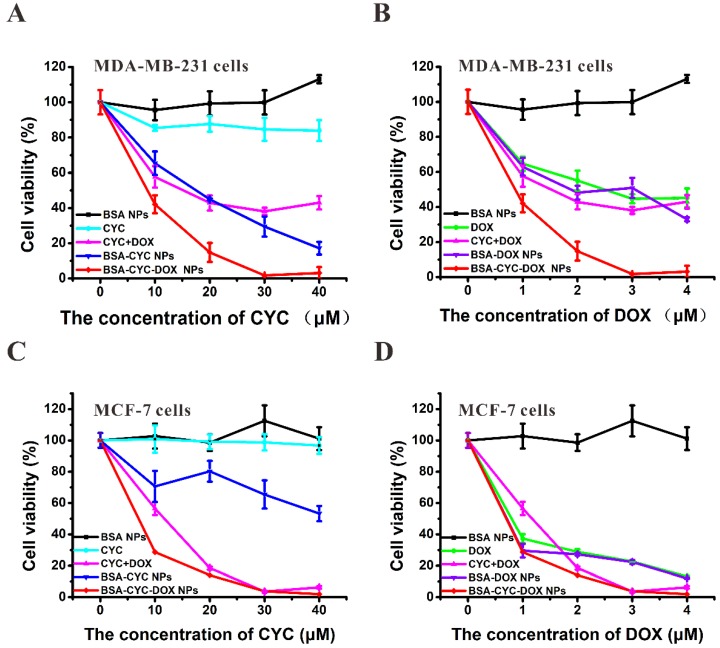
Figure 2.
Growth inhibition of MDA-MB-231 and MCF-7 cells treated with different drug dosages for 48 h. (a-b). The growth inhibition curve of MDA-MB-231 cells depending on different CYC (a) and DOX (b) dosages. (c-d). The growth inhibition curve of MCF-7 cells depending on different CYC (c) and DOX (d) dosages.

