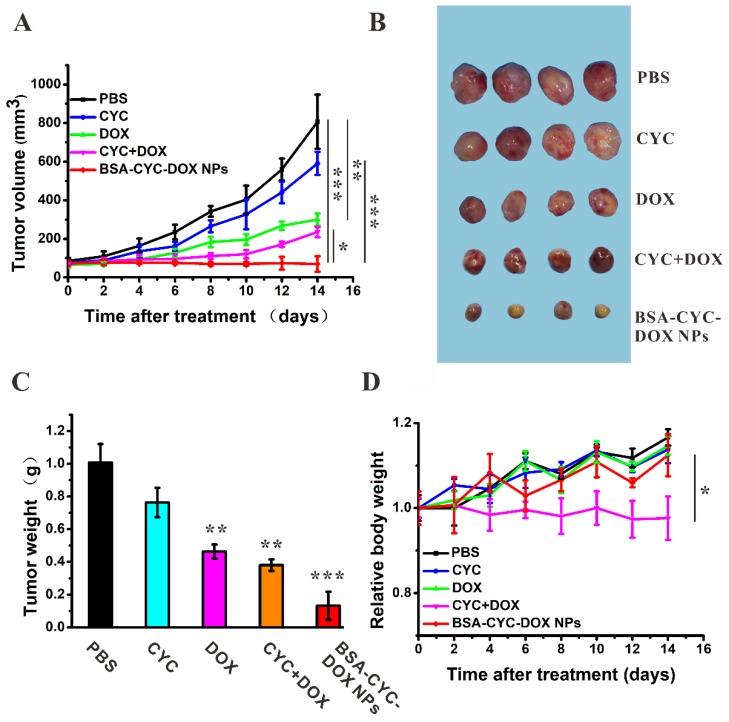
Figure 4.
In vivo anti-tumor activity of drugs and drugs-loaded NPs. (a). Tumor growth curves of mice treated with PBS, CYC, DOX, CYC + DOX and BSA-CYC-DOX NPs. (b). The image of tumors isolated from the nude mice on day 14. (c). Histogram of mean tumor weight measured on day 14. (d). The relative body weight of mice. Data were expressed as mean ± SD (n = 4). * P < 0.05, ** P < 0.01 and *** P < 0.001.

