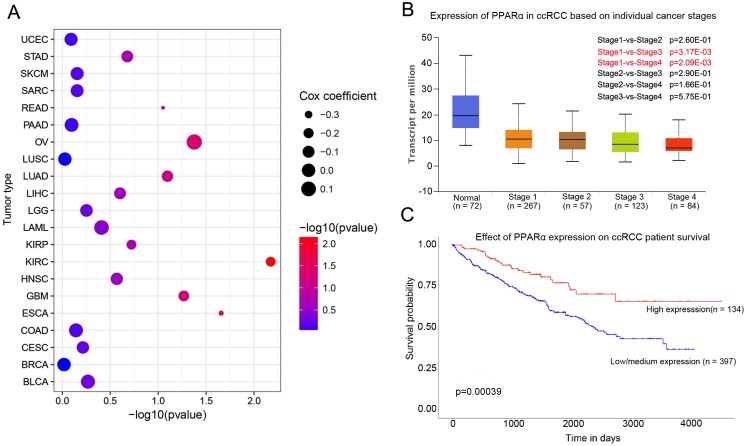
Figure 1.
PPARα expression in various cancer and correlation with stages and survival in ccRCC. (A) Bubble chart showing the correlation between PPARα and different tumor types in the Oncolnc database. The x-axis represents -log10 (p value), and y-axis represents the abbreviation of diverse cancer types (the full name of each cancer could be found in the Oncolnc database). The size and color of the bubble indicates the Cox coefficient and -log10 (p value), respectively. (B) Box plot showing the correlation between PPARα and kidney renal clear cell cancer stages in UALCAN database. (C) Kaplan-Meier survival curves revealing PPARα expression and survival probability in renal clear cell cancer.

