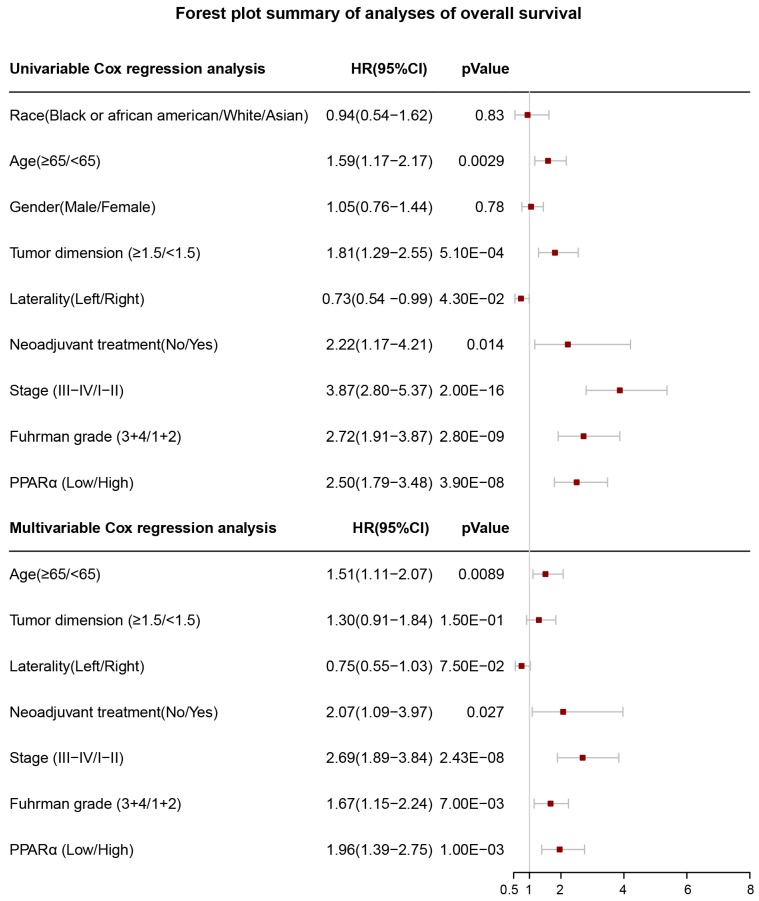
Figure 5.
Forest plot summary of analyses of overall survival (OS). Univariable and multivariable analyses of race, age, gender, tumor demension, laterality, neoadjuvant therapy, stage, Fuhrman grade and PPARα expression group for overall survival (OS) in ccRCC patients. The red squares on the transverse lines represent the hazard ratio (HR), and the gray transverse lines represent 95% CI.

