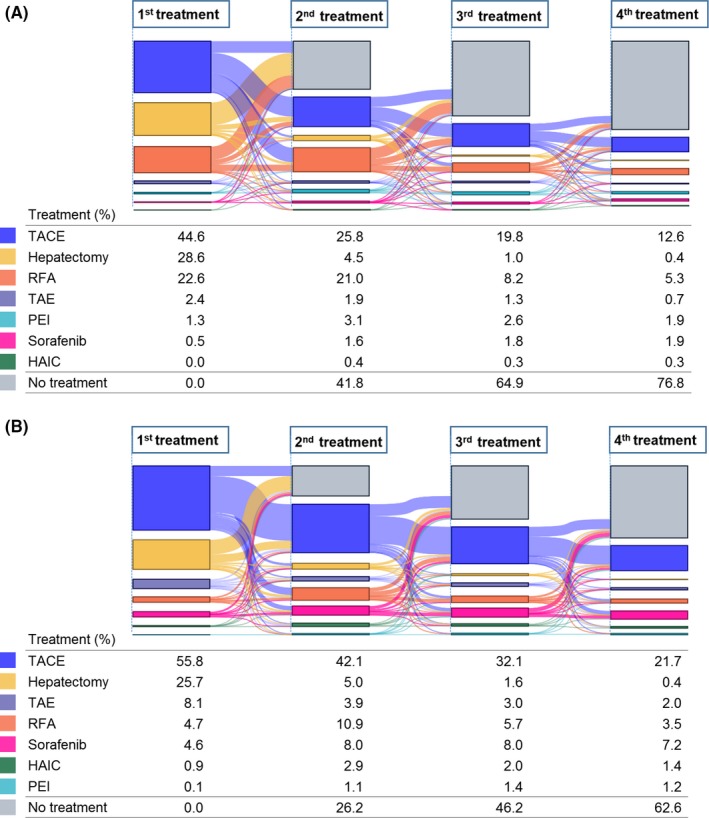
Figure 1.

Sankey diagram of treatment flow for HCC patients. Change of treatments from first to fourth‐line were observed in early (A) and advanced (B) stages. The color indicates the treatment type and the flow size as percentages of patients. TACE, transcatheter arterial chemoembolization; TAE, transcatheter arterial embolization; RFA, radiofrequency ablation; PEI, percutaneous ethanol injection; HAIC, hepatic arterial infusion chemotherapy
