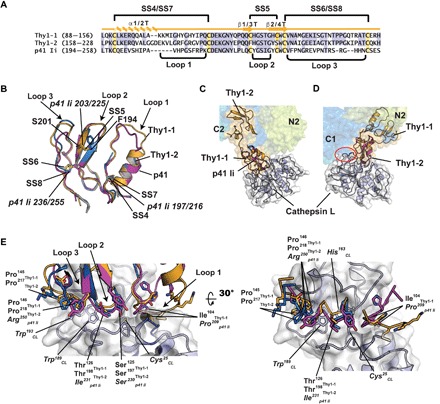
Fig. 2. Comparison of Sxph Thy1-1 and Thy1-2 with p41 Ii.

(A) Sequence comparison. Thy1-1 and Thy1-2 secondary structure elements and disulfide bonds are indicated. Cysteines and conserved residues are highlighted yellow and blue, respectively. (B) Cartoon diagram superposition of Thy1-1 (light orange), Thy1-2 (marine), and p41 Ii (magenta) (PDB: 1ICF) (38). Disulfide bonds (italics) and select residues are labeled. Thy1-1 and Thy1-2 have root mean square deviation of Cα position (RMSDCα) = 0.61 and 0.64 Å over 43 and 42 residues, respectively. p41 Ii has RMSDCα = 0.57 Å over 53 residues of Sxph Thy1-1 and Thy1-2. (C and D) Superposition of Sxph on the p41 Ii:cathespin L complex (PDB: 1ICF) (38) using the (C) Thy1-1 and (D) Thy1-2 domains. In (D), red oval indicates cathepsin L and Sxph C1 clash. Sxph colors are the same as in Fig. 1A. (E) Superposition of Sxph Thy1-1 (light orange), Thy1-2 (marine), and p41 Ii (magenta) in the context of the p41 Ii:cathepsin L interface.
