
Fig. 3. Sxph STX-binding site.
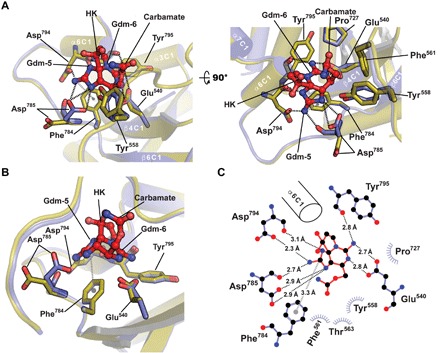
(A) Apo-Sxph (olive) and STX-bound Sxph (slate) superposition cartoon diagram. STX-interacting residues are shown as sticks. Key secondary structure elements are labeled. Black and gray dashed lines indicate hydrogen bond networks and the cation-π interaction, respectively. STX is shown as red sticks. Gdm-5, Gdm-6, and HK indicate the five- and six-membered guanidinium rings and hemiketal, respectively. (B) STX-binding site highlighting the cation-π interaction (gray) and Asp785 movement. (C) LIGPLOT diagram of the STX-binding site. α6C1 is shown for orientation.