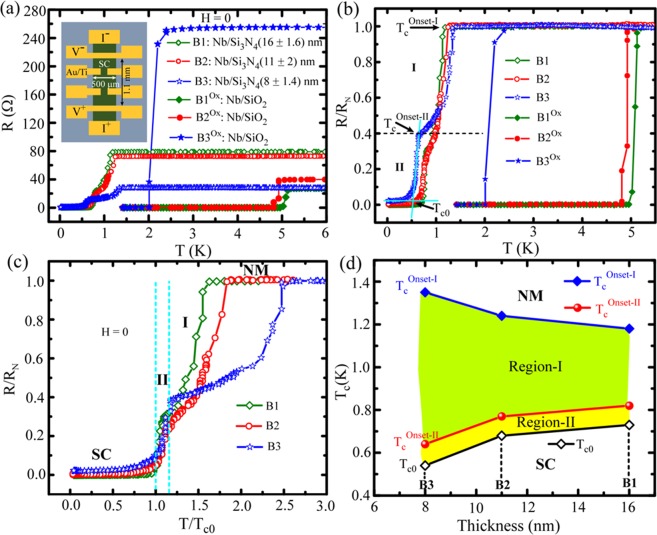
Figure 3.
Temperature dependent resistance [R(T)] measured at zero-field. (a) A set of for three nitride samples with varying thickness and three related to Nb control samples. For each thickness, one nitride sample and one control sample from the same batch have been selected. Inset: device geometry. (b) The same set of R(T) is shown with the resistance values normalized by the normal state resistance (RN) of individual sample. (c) Normalized resistance for the nitride samples are presented in reduced temperature (T/Tc0) scale. The vertical dotted lines represent the two transition regimes region-I and region-II. (d) Variation of different transition temperature (Tc) values, defined in (b), with thickness for the nitride samples. The shaded regions indicate the dependence of transition width for the two transition regions on the sample thickness.

