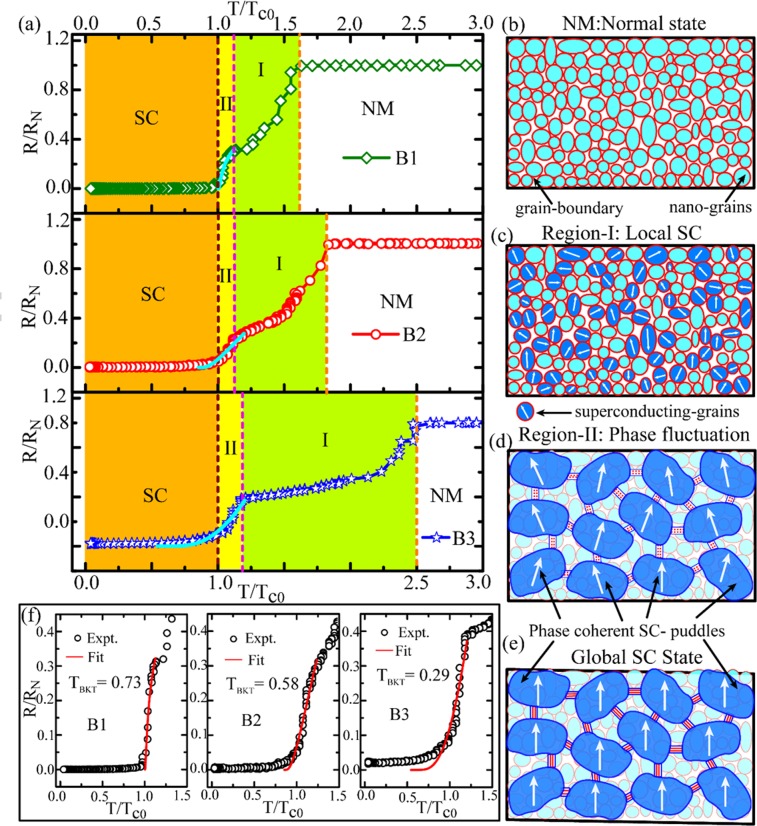
Figure 7.
Representation of NM-SC phase transition of Nb2N thin films pictographically by using R(T) characteristics and the granular structure of the samples. (a) Normalized resistance in reduced temperature scale separately for all the three nitride samples. The colored shaded regions bounded by the dotted vertical lines represent different stages of the phase transition and the stages are illustrated schematically through (b) to (e). Illustration of the granular films in normal state (b), establishment of local superconductivity in individual grains for the transition region-I (c), formation of superconducting puddle by combining phase coherent superconducting nano-grains in region-II (d), and finally the establishment of global coherence among the puddles to achieve the superconducting state (e). The solid cyan curves shown in (a) for the resistive transition in region-II represent the BKT transition using Halperin-Nelson equation which provides the BKT transition temperature TBKT and the fittings for individual samples are shown in (f) which selectively displays the fitting regions for all the three nitride samples. The details are explained in the text.

