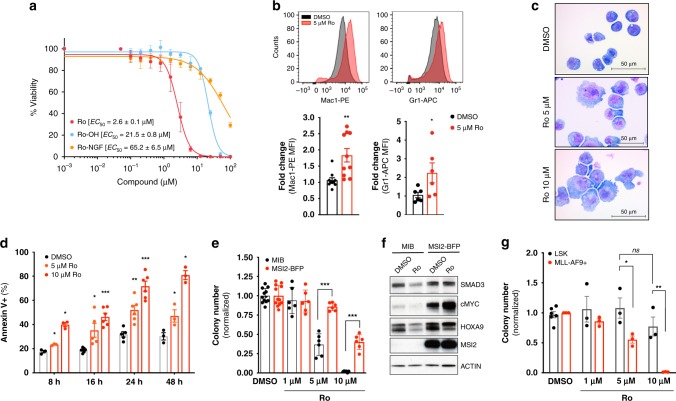
Fig. 3.
Ro 08–2750 increases differentiation and apoptosis in myeloid leukemia cells. a Cytotoxicity assay (Cell-Titer Glo) of Ro (red), Ro-OH (cyan) and Ro-NGF (orange) in MLL-AF9+ BM cells. 50% Effective Concentration (EC50) values, average of at least three independent experiments ± standard deviation are shown. b Flow cytometry representative histograms of DMSO (gray) and 5 μM Ro (red) treated MLL-AF9+ BM cells with myeloid differentiation markers (Mac1 and Gr1); bar graphs (below) show average (fold change increase) ± standard error mean of three independent experiments, performed in triplicate. Paired t-test, *p < 0.05; **p < 0.01. c Representative immunocytochemistry images of cytospun MLL-AF9 + BM cells control (DMSO) or Ro treated (5 and 10 μM) and stained by Eosin Y and Methylene Blue/ Azure A. Scale, 50 μm. d Apoptosis analysis by Annexin V+ (% population) for MLL-AF9 + BM cells cultured in absence (DMSO, black) or presence of Ro 5 μM (light red) or 10 μM (red). Results represent at least three independent experiments ± s.e.m. e Colony Formation Unit (CFU) assay of MLL-AF9 + Puro-CreER + Msi1fl/fl Msi2fl/fl BM cells transduced with MSCV-IRES-BFP (MIB, control) or MSCV-IRES-MSI2-BFP (MSI2-BFP) retroviral vectors after Ro treatment 1, 5 and 10 μM. Results represent the average ± s.e.m. of colony numbers of at least five experiments performed in duplicate. f Representative immunoblot of MLL-AF9 + Puro-CreER + Msi1fl/fl Msi2fl/fl BM MIB (black bars) and MSI2-BFP (red bars) cells (used in panel e) after DMSO or 10 μM Ro treatment for 4 h. β-ACTIN, loading control. g CFU assay of Lin-Sca+cKit+ (LSK) versus MLL-AF9+ BM cells demonstrates Ro 08–2750 therapeutic window. Results represent the average ± s.e.m. of colony numbers of three experiments performed in duplicate. Two tailed Paired t-test (b, d, e and g), *p < 0.05, **p < 0.01, ***p < 0.005. Source data are provided as a Source Data file

