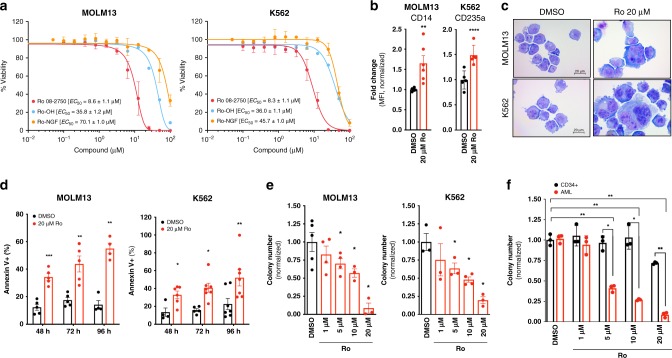
Fig. 4.
Ro 08–2750 treatment inhibits survival of human AML cell lines and patient cells. a Cytotoxicity assay (Cell-Titer Glo) of Ro, Ro-OH and Ro-NGF in MOLM13 and K562 cells. EC50 values average of three independent experiments ± s.d. is shown. b Mean Fluorescence Intensity (MFI) fold changes of CD14 (myeloid marker, MOLM13) and GlycA (Glycophorin-A, CD235a; erythroid marker, K562) after 48 h treatment with DMSO (control, black bars), Ro (red bars) at 20 μM. Data is normalized to DMSO control cells. Representative histograms for each marker are shown in Supplementary Fig. 6a. c Representative immunocytochemistry images of cytospun MOLM13 and K562 cells treated for 48 h with DMSO (control), Ro 20 μM and stained with Eosin Y and Methylene Blue/ Azure A. Scale, 20 μm. d Apoptosis analysis by Annexin V+ (% population). MOLM13 and K562 were cultured in DMSO (black bars) or in the presence of Ro 20 μM (red bars) for the indicated times and Annexin V positivity and 7AAD was measured. Results represent three independent experiments ± s.d. e CFU assay of MOLM13 and K562 in the presence of Ro at different concentrations (1, 5, 10, and 20 μM). Data is shown as average colony numbers (normalized to DMSO control) ± s.e.m. of at least three independent experiments. f CFU assay of cord-blood derived CD34 + HSPCs and AML patient BM cells. Data is shown as average colony numbers (normalized to DMSO) ± s.e.m. of three different blood donors for CD34 + and three independent AML patients. Two tailed Paired t-test (DMSO versus Ro treated, unless indicated with lines); *p < 0.05; **p < 0.01; ***p < 0.005, ****p < 0.001. Source data are provided as a Source Data file

