Fig. 5.
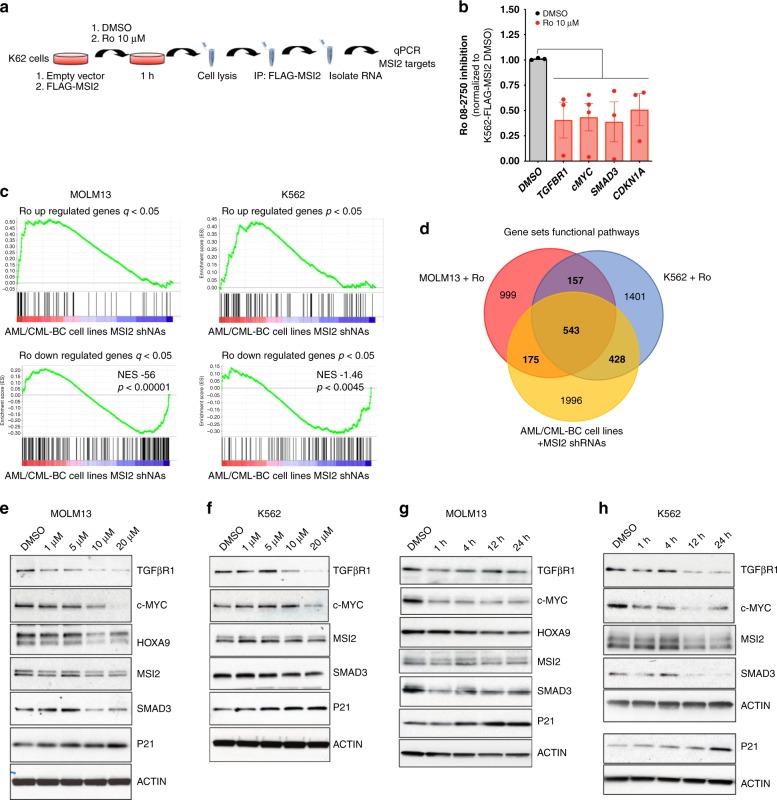
Ro 08–2750 treatment corresponds with MSI2 shRNA depleted gene signature. a Scheme of RNA-immunoprecipitation (IP) protocol followed with K562-MIG (MSCV-IRES-GFP) or FLAG-MSI2 overexpressing cells. b Ro 08–2750 inhibitory effect in the RNA-IP enrichment of MSI2 mRNA targets in K562-FLAG-MSI2 versus K562-MIG after 1 h treatment at 10 μM. Data is shown as average of inhibition effect (normalized to DMSO cells) ± s.e.m. of four independent experiment. c Upregulated and down-regulated gene sets obtained by RNA-seq analysis after 20 μM Ro 4 h treatment in MOLM13 and K562 cells showing identical signature as previously obtained using shRNA against MSI2 in CML-BC and AML lines27. d Venn diagram showing gene Set Enrichment Analysis (GSEA) overlap between MOLM13 (red), K562 (blue) (after 20 μM Ro 4 h treatment) and AML/CML-BC cell lines MSI2 depleted with shRNAs (yellow) from Kharas et al.27. Bold values inside brackets below each grup are total gene sets numbers. e Representative immunoblot for MOLM13 treated with Ro at different concentrations (1, 5, 10, and 20 μM) for 4 h showing expression of MSI2 targets. HOXA9 is not expressed in this BCR-ABL+ (CML-BC) leukemia cell line. f Representative immunoblot for K562 treated with Ro at different concentrations for 4 h showing expression of MSI2 targets. g Representative immunoblot for MOLM13 treated with Ro 20 μM at different time points (1, 4, 12 and 24 h) showing expression of same MSI2 targets as in panel e. h Representative immunoblot for K562 treated with Ro 20 μM at different time points with an effect on MSI2 targets. P21 and β-ACTIN from a different representative gel are shown. Source data are provided as a Source Data file

