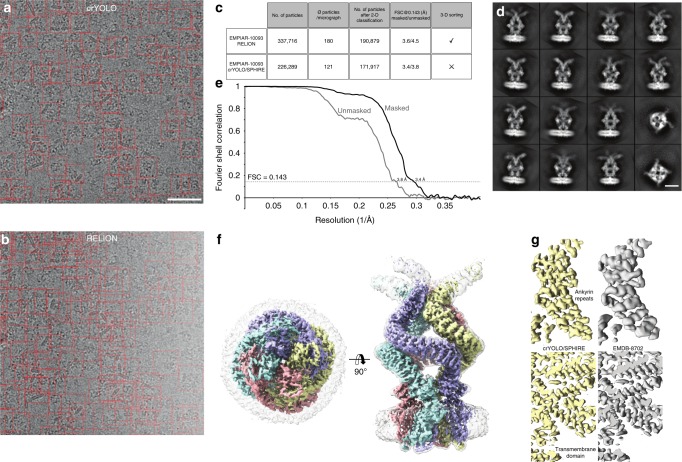
Fig. 4.
Selection of NOMPC particles and structural analysis. a, b Representative micrograph (micrograph number 1854) of the EMPIAR-10093 dataset. Particles picked by a crYOLO or b RELION, respectively, are highlighted by red boxes. Scale bar, 50 nm. c Summary of particle selection and structural analysis using RELION and crYOLO/SPHIRE. d Representative reference-free 2-D class averages obtained using the ISAC and Beautifier tools (SPHIRE) from particles selected by crYOLO. Scale bar, 10 nm. e FSC curves and f final 3-D reconstruction of the NOMPC dataset obtained from particles picked using crYOLO and processed with SPHIRE. The 0.143 FSC between the masked and unmasked half-maps indicates resolutions of 3.4 and 3.8 Å, respectively. The 3-D reconstruction is shown from the top and side. To allow better visualization of the nanodisc density, the unsharpened (gray, transparent) and sharpened map (colored by subunits) are overlaid. g Comparison of the density map obtained by crYOLO/SPHIRE with the deposited NOMPC 3-D reconstruction EMDB-8702

