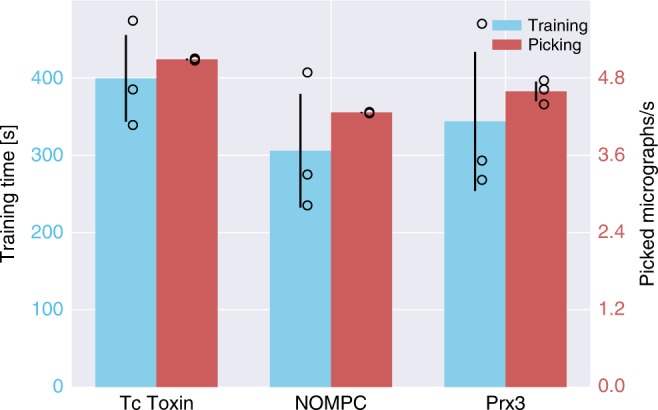
Fig. 8.

Computational efficiency statistics of training and particle selection. The crYOLO training times for TcdA1, NOMPC, and Prx3 were 400s, 300s, and 343s, respectively (blue bars). The red bars depict the number of processed micrographs per second during particle selection. Error bars represent SD, measured by training and applying crYOLO three times (black circle). All datasets were picked in less than a quarter of a second per image. For TcdA1, crYOLO needed 0.19 s per micrograph, 0.23 s for NOMPC, and 0.21 s for Prx3
