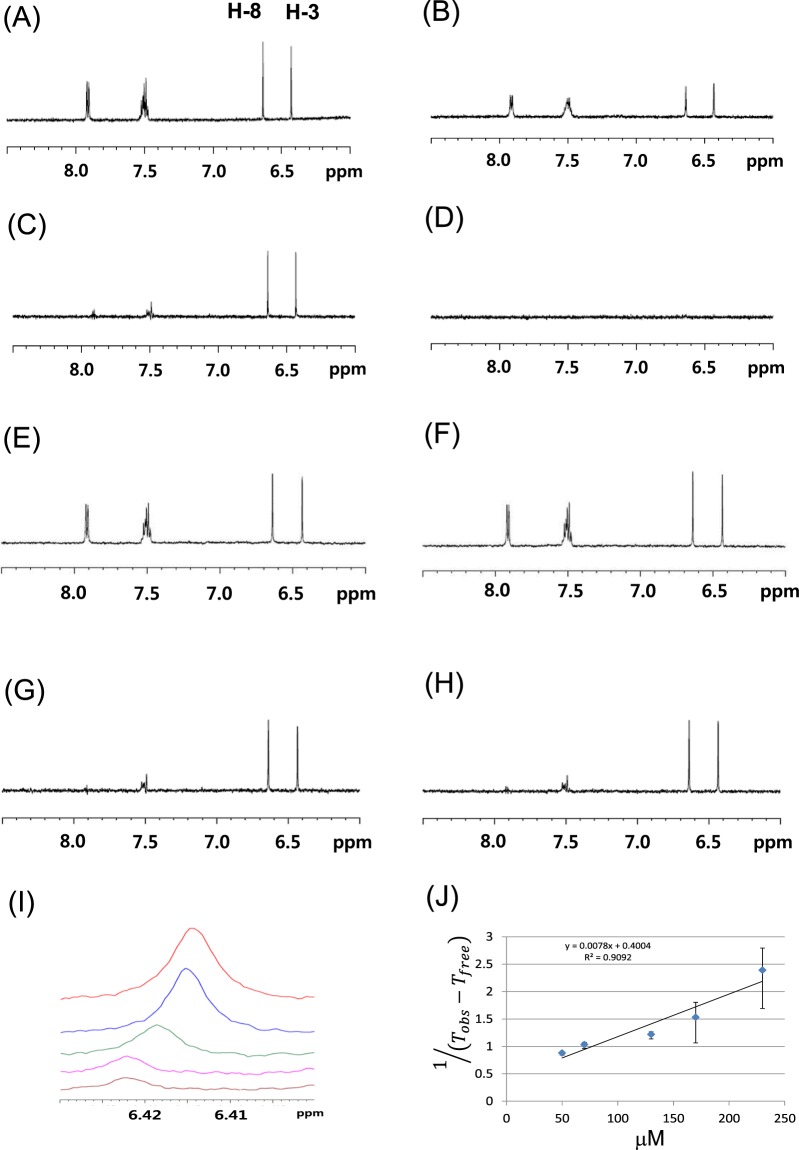
Figure 2.
(A–D) Series of 1D NMR spectra of 1 in the aromatic region in the absence (A and C) or presence (B and D) of hTSLP. Normal 1D spectra of 1 (A and B), and 1D relaxation-edited NMR spectra with 400 ms-long CPMG pulse sequences (C and D). (E,F) Series of 1H 1D NMR spectra of 1 in aromatic region in the presence of hTSLPR (E) and carbonic anhydrase (F). (G,H) 1D relaxation-edited NMR spectra of 1 in aromatic region in the presence of hTSLPR (G) and carbonic anhydrase (H). (I) 1H NMR spectra of H3 signal of 1 at various concentrations. (J) Plot of the equation, , versus concentration of 1. The line was determined using weighted linear least-squares fit.

