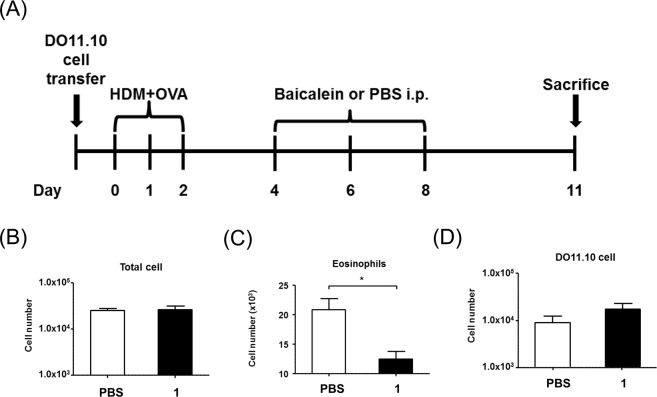
Figure 5.
(A) Experimental design. On day 11 post allergen challenge, BAL was performed to determine eosinophilic inflammation. (B) Total cells from airways were counted to determine differential immune responses between the control and HDM-challenged groups. (C) Number of eosinophils assessed using cytospin followed by Diff-Quik staining. (D) Number of allergen-specific T cells was determined by flow cytometry. Data are means of three independents experiments (3/group). Values are mean ± standard error of the mean (SEM) (*P < 0.05).

