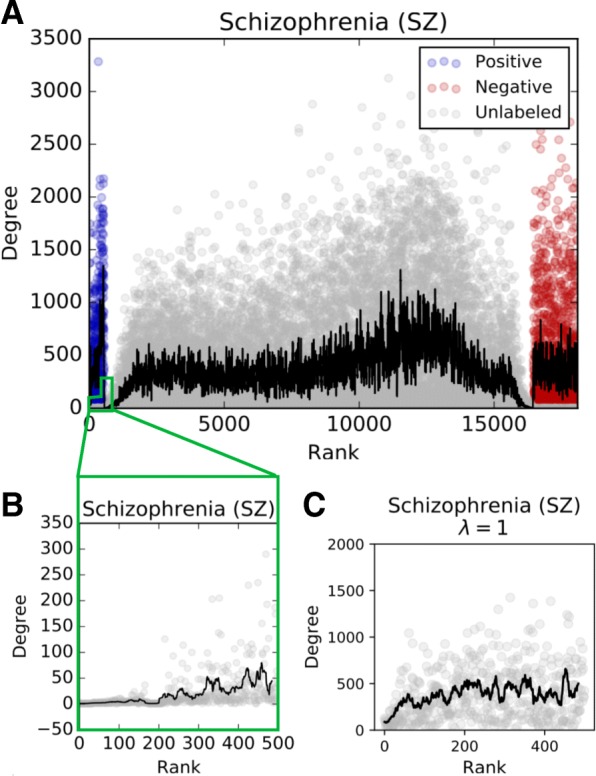
Fig. 5.

a Node ranking (x-axis) by degree (y-axis) of SINKSOURCE run on the schizophrenia dataset. Black line denotes moving average (15 nodes). b First 500 unlabeled nodes from a illustrating low degree for top-ranked unlabeled nodes. c First 500 unlabeled nodes from PSEUDO-SINKSOURCE+ (λ=1) run on the schizophrenia dataset
