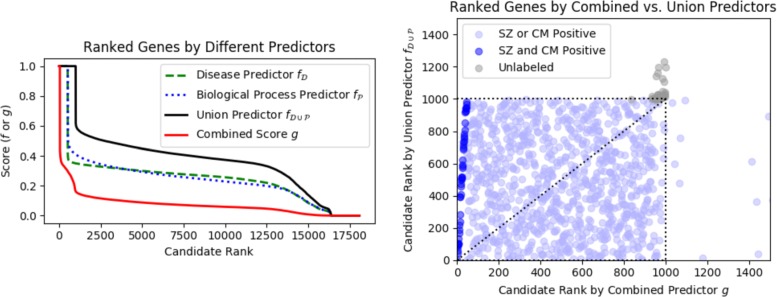
Fig. 7.
PSEUDO-SINKSOURCE+ runs on different positive sets for λ=1 for schizophrenia as the disease set . (Left) Genes ranked by score according to schizophrenia , cell motility , union and combined score g. (Right) Scatter plot of gene rankings in combined g vs. union . Each point is a gene, and the first 1000 ranked nodes in each method are plotted (dotted box)

