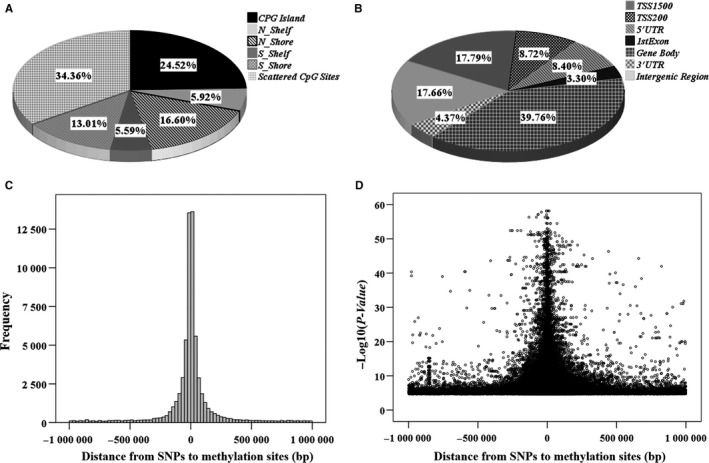
Figure 2.

The distribution of cis‐meQTL associated methylation sites. (A) The distribution according to their positions in the UCSC CpG island region. (B) The distribution according to gene region feature category (UCSC). (C) The frequency distribution Note: Distance indicates the physical distance from SNP to their associated methylation site. (D) The distribution according to association significance (‐log10(P‐value)) against the physical distance from SNP to their associated methylation site
