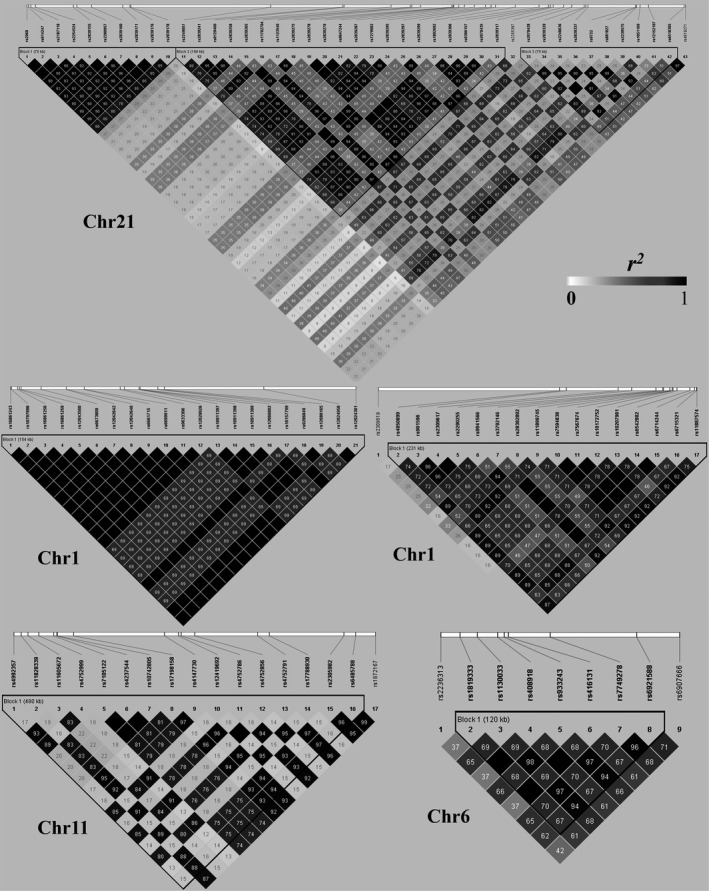
Figure 4.

Linkage disequilibrium (LD) analysis. HaploView 4.2 was used to analyse the linkage disequilibrium. The SNPs used in LD analysis are from the significant SNP‐methylation‐mRNA regulatory chains. The shades of colour represent r 2, deeper colour represent the higher value of r 2. Each number in cell represents r 2 between neighbouring SNPs. The black cells without numbers means r 2 = 1
