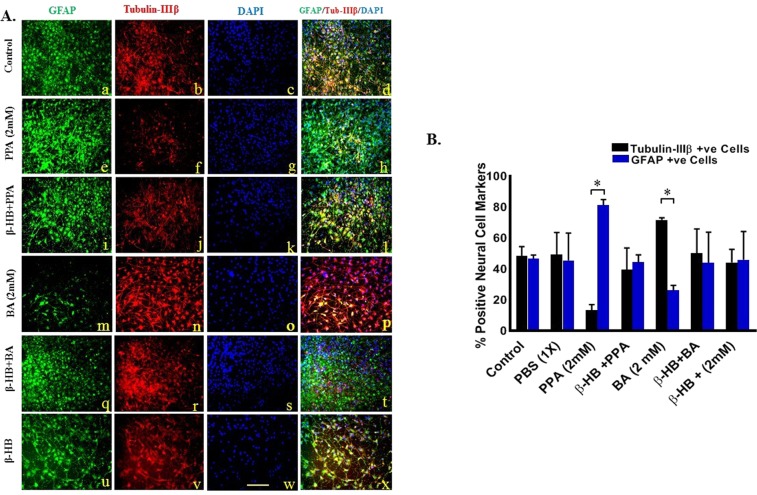
Figure 2.
PPA Promotes Glial Cells Differentiation In Vitro. (A) Depicts fluorescent representative images of differentiated cells from hNSCs with green color for GFAP positive cells (a,e,I,m,q, and u), red for Tubulin-IIIβ positive cells (b,f,j,n,r, and v), blue color for DAPI positive cells (c,g,k,o,s, and w), and merged images of all three channels per treatment in (d,h,l,p,t, and x) for Control, PPA (2 mM), β-HB + PPA, BA (2 mM), β-HB + BA, and β-HB treatments, respectively. Magnification 25x and scale bar 25 um. (B) Represents quantitative analysis of the Mean of % positive neural cell markers over total DAPI with black bars for Tubulin-IIIβ positive, and blue bars for GFAP positive cells. Data was collected from a minimum of (n = 3) random areas per duplicated treatment setting. Statistical significance was tested using One-way ANOVA followed by Tukey and confirmed with Wilcoxon matched-pairs tests. (*p < 0.05, F (13, 28) = 2.520), for GFAP vs Tubulin-IIIβ positive cells within the ([) limited treatments.

