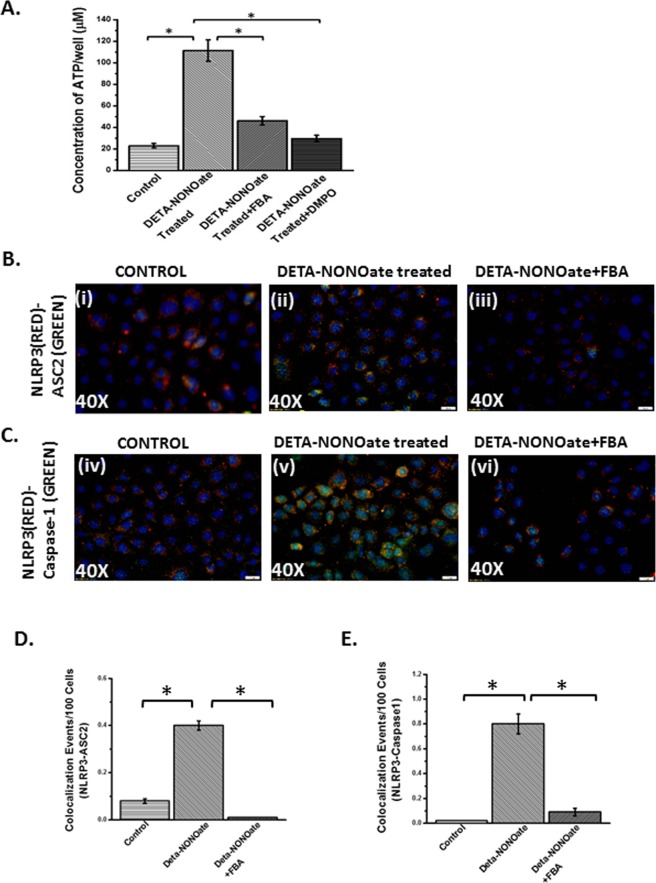
Figure 15.
(A) ATP assay was performed using the Intestinal Epithelial cells (IEC-6) cell supernatants for the groups Control, DETA-NONOate treated, DETA-NONOate treated+ FBA and DETA-NONOate treated + DMPO, to study the concentration of ATP per well. (n = 3, analysis from three samples) (*p < 0.05). Intestinal epithelial (IEC-6) cell line was used as control (CONTROL), one group was treated with the supernatant of IEC-6 cell line that was treated with NO-donor (DETA-NONOate), another group of cells were blocked by FBA and then was treated with the NO-donor (DETA-NONOate) (DETA-NONOate + FBA). The cell groups were used for immunofluorescence imaging. (B) (i–iii) Immunofluorescence images depicting NLRP3 (red)-ASC2 (green) colocalization and (C) (iv–vi) NLRP3 (red)- Caspase-1 (green) colocalization, counterstained with DAPI (blue) in CONTROL, DETA-NONOate,DETA-NONOate + FBA, group of IEC-6 cells. Images were taken at 20X magnification. (D) Morphometric analysis of NLRP3-ASC2 and (E) NLRP3-Caspase1 colocalized events. Y-axis shows % positive immunoreactive area (% ROI) (n = 5, analysis from five separate microscopic fields) (*p < 0.05).

