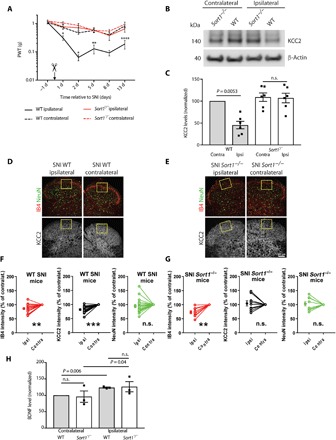
Fig. 1. KCC2 down-regulation is prevented in sortilin-deficient mice.

(A) Paw withdrawal threshold (PWT) to tactile stimuli of ipsilateral versus contralateral sides of WT and Sort1−/− mice before and after SNI (day 0). *P < 0.02, **P < 0.009, and ****P < 0.0001; n.s., not significant; n = 7 to 8, two-way repeated measures (RM) analysis of variance (ANOVA) with post hoc Tukey’s test [F(3,26) = 31.52, P < 0.0001], means ± SEM. (B) Representative Western blot of KCC2 in L3-L5 SDH 6 days after SNI. (C) KCC2 levels in L3-L5 SDH quantified by Western blot and normalized to WT contralateral 6 days after SNI. n = 6, one-way RM ANOVA with post hoc Tukey’s test [F(1.997,9.985) = 15.06, P = 0.001], means ± SEM. (D and E) IHC analysis showing IB4, NeuN, and KCC2 expression in the ipsilateral and contralateral SDH of WT and Sort1−/− mice. Scale bar, 100 μm. (F and G) Comparisons of average pixel intensity are shown across SNI animals of WT versus Sort1−/− mice in the region of interest (ROI). Nerve injury resulted in decreased IB4 intensity in the ROI in WT mice (contralateral versus ipsilateral: paired t test, t = 3.749; df = 18, P = 0.0015; n = 19) as in Sort1−/− mice (contralateral versus ipsilateral: paired t test, t = 4; df = 8, P = 0.004; n = 9). Nerve injury caused the down-regulation of KCC2 expression in the dorsal horn of WT mice but not in Sort1−/− mice [contralateral versus ipsilateral: (WT mice) paired t test, t = 6.24; df = 18, P < 0.0001; n = 19; and (Sort1−/− mice) t = 0.2093; df = 8, P = 0.839; n = 9]. No loss of neurons, measured as the difference in the average NeuN immunostaining intensities, was observed between ipsilateral and contralateral sides in both WT and Sort1−/− mice [contralateral versus ipsilateral: (WT mice) paired t test, t = 1.206; df = 18, P = 0.2436; n = 19; and (Sort1−/− mice) t = 0.3838; df = 8, P = 0.7111; n = 9]. **P < 0.01 and ***P < 0.0001; intensity units (i.u.) are shown as means ± SEM. (H) BDNF levels 6 days after SNI in L3-L5 SDH relative to WT contralateral [n = 3, pooled samples from eight mice for each run, paired t test within genotype (WT: t = 13.42, df = 2; Sort1−/−: t = 4.62, df = 2) and unpaired t test between genotypes (means ± SEM)].
