
Figure 3.
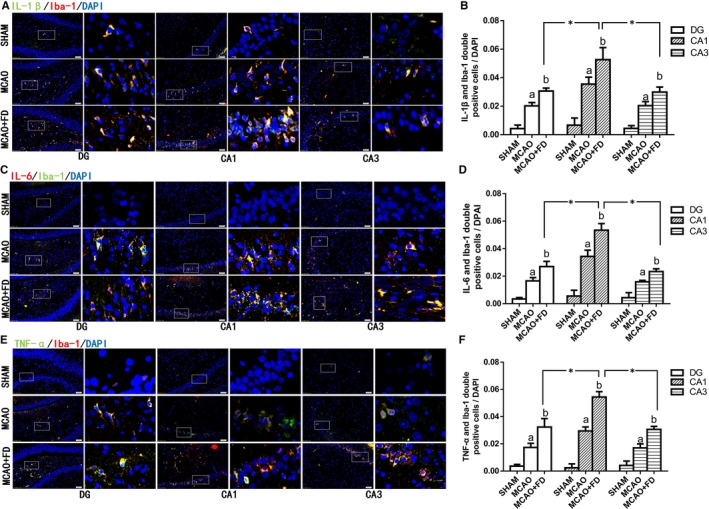
Folic acid deficiency (FD) induced neuroinflammatory cytokines accumulation in activated microglia following ischaemia reperfusion. A, Dual‐immunofluorescence of Iba‐1(red) and IL‐1β (blue) in hippocampal subregions. C, Dual‐immunofluorescence of Iba‐1(blue) and IL‐6 (red) in hippocampal subregions. E, Dualimmunofluorescence of Iba‐1(red) and TNF‐α (blue) in hippocampal subregions. Each right‐hand column depicts a magnified image of the rectangular region of the corresponding image in the left column. Nuclei were stained for 4, 6‐diamidino‐2‐phenylindole (DAPI) (blue). Quantification of Iba‐1+/IL‐1β+(E), Iba‐1+/IL‐6+ (D) and Iba‐1+/TNF‐α+ (F) double‐stained cells/total number of DAPI‐stained nuclei in hippocampal CA1, CA3 and DG regions. The data are presented as the mean ± SD (n = 4 each group). *P < 0.05 vs the CA1 region, a P < 0.05 vs the sham‐operated control group (SHAM), b P < 0.05 vs the MCAO group. Scale bars = 50 μm. IL‐1β, interleukin‐1beta; IL‐6, interleukin‐6; TNF‐α, tumour necrosis factor‐α