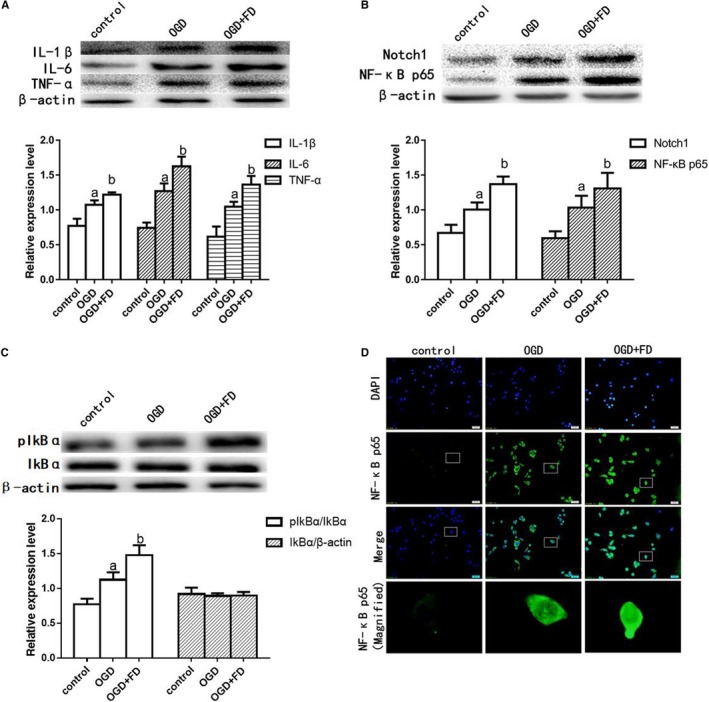
Figure 5.

Oxygen‐glucose deprivation (OGD) activated Notch1/nuclear factor kappa B (NF‐κB) and neuroinflammatory cytokines protein expression in BV‐2 cells. A, Western blot analysis of interleukin‐1beta (IL‐1β), interleukin‐6 (IL‐6) and tumour necrosis factor‐α (TNF‐α); (B) Western blot analysis of Notch1 and NF‐κB p65. C, Western Blot analysis of pIkBα; β‐actin protein was used here as an internal control. D, Nuclear factor kappa B p65 immunostaining of the BV‐2 cells. The data are presented as the mean ± SD (n = 4 each group). a P < 0.05 vs the control group, b P < 0.05 vs the OGD group
