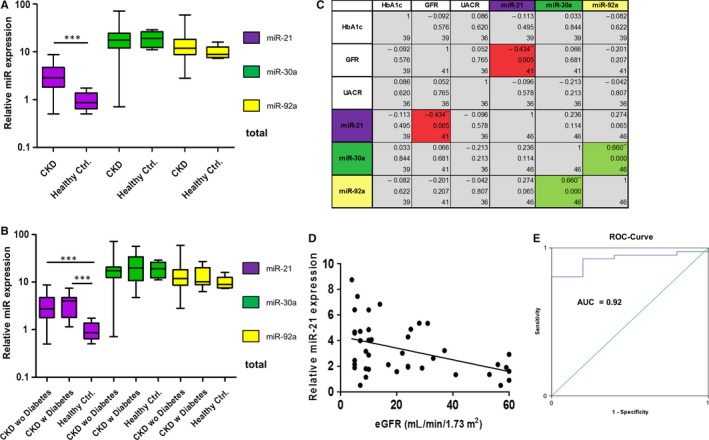
Figure 1.

Levels of urinary exosomal miR‐21, miR‐30a‐5p and miR‐92a in chronic kidney disease (CKD) patients and healthy controls. MiR levels were measured by RT‐qPCR normalized against inter‐run calibrator and miR‐16. MiR‐21 is significantly up‐regulated in CKD patients. y‐axis = Log10, error bars = SD (A). There is no difference between CKD patients with or without diabetes y‐axis = Log10, error bars = SD (B). MiR‐21 is negatively correlated with eGFR (red boxes). MiR‐30a‐5p is positively correlated with miR‐92a (green boxes) (C,D). Boxes top down: R (correlation coefficient), P‐value, n. *P ≤ 0.05, **P ≤ 0.01, ***P ≤ 0.001 (C), y‐axis = Log2 (D). ROC‐curve analysis of miR‐21. Green line = diagonal; blue line = ROC‐curve; AUC, area under the curve (E)
