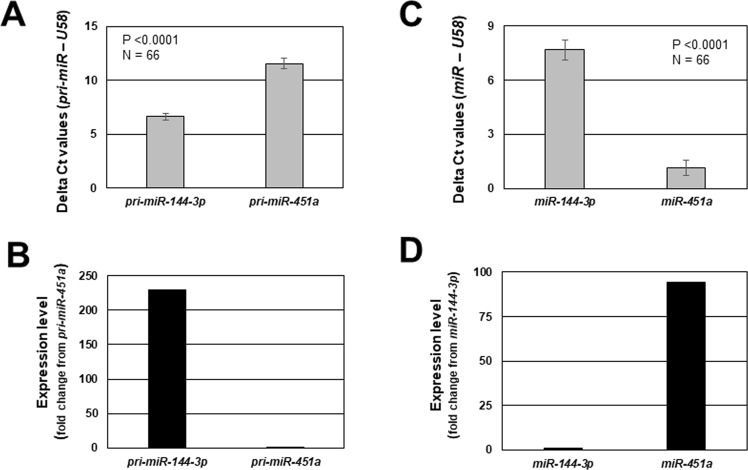
Figure 5.
Comparison of average pri- and mature miR-144-3p and miR-451a expression in endometriotic lesion tissue. Pri-miR-144-3p and pri-miR-451a expression are presented as delta ct values (A) and fold change from pri-miR-451a (B) while mature miR-144-3p and miR-451a are presented as delta ct values (C) and fold change from miR-144-3p (D). These data are presented to emphasize the greater level of pri-miR-144-3p expression compared pri-miR-451a, but the greater expression of mature miR-451a despite the low levels of lesion pri-miR-451a expression.

