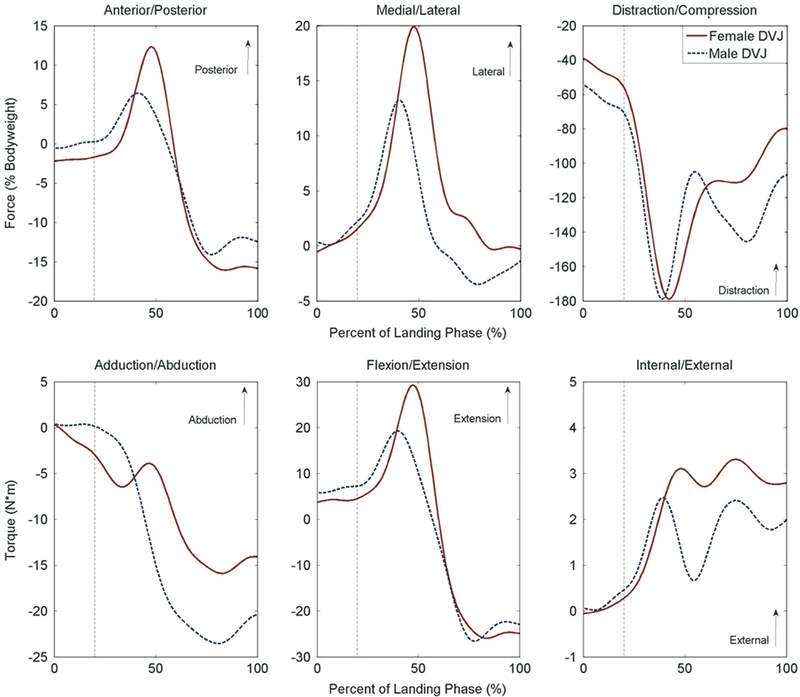
Fig. 3.

Displays the population average force (top row) and torque (bottom row) measured at the tibiofemoral joint in response to simulated male and female DVJ articulations. Landing phase begins at initial contact (0%) and concludes at maximum flexion (100%) (Bates et al., 2013). The vertical, dashed line represents the approximate cutoff for the first 50 ms after initial contact, where ACL injuries are most likely to occur (Krosshaug et al., 2007).
