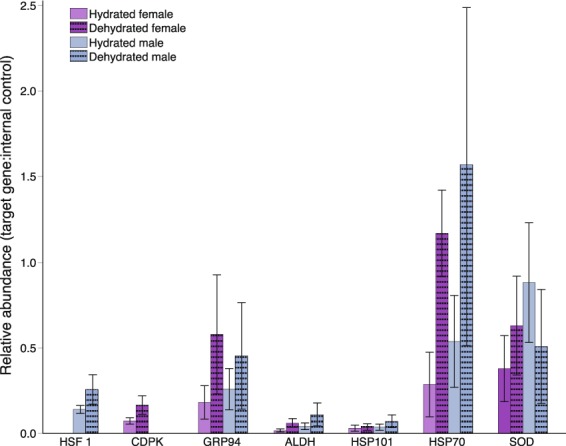
Figure 5.

Relative expression of candidate dehydration associated genes in three male and three female plants under hydrated and dehydrated conditions. Gene expression estimates were standardized using an internal control gene (actin). The expression of each candidate gene relative to actin was computed to estimate relative abundance. Absence of a bar (as seen for HSF 1 and CDPK) indicates that there was no amplification of that gene in the corresponding sample. Error bars are standard error of the mean.
