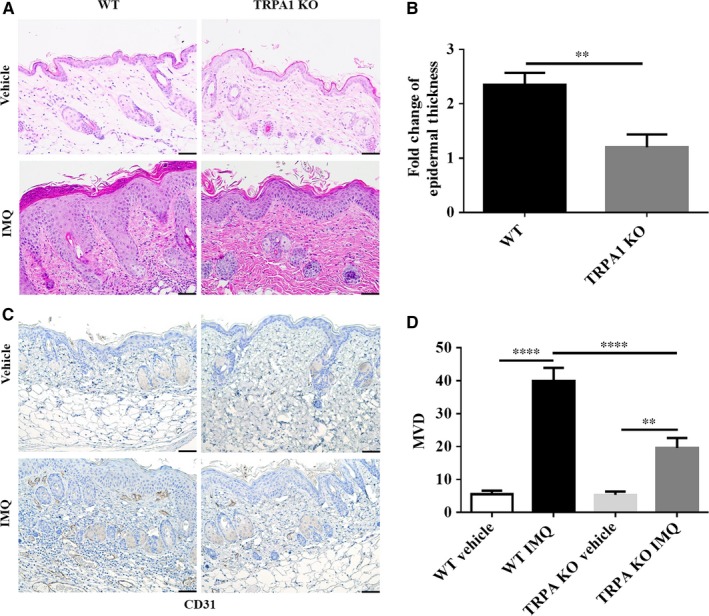
Figure 3.

IMQ‐treated TRPA1 KO mice show reduced epidermal thickness and angiogenesis compared to WT mice after 5 days. (A) Histological examination. (B) Fold‐change of epidermal thickness (n = 12 in vehicle group, n = 20 in IMQ group). (C) Representative image of IHC of angiogenesis (CD31). (D) Quantification of MVD (n = 6 per group). Scale bar = 50 μm. T‐test for epidermal thickness change, one‐way ANOVA followed by post‐hoc comparison (Tukey's HSD) test for MVD. Mean ± SEM values are indicated (**P < 0.01, ****P < 0.0001). IMQ, imiquimod; KO, knockout; MVD, microvascular density; IHC, Histopathology and immunochemistry; WT, wild‐type
