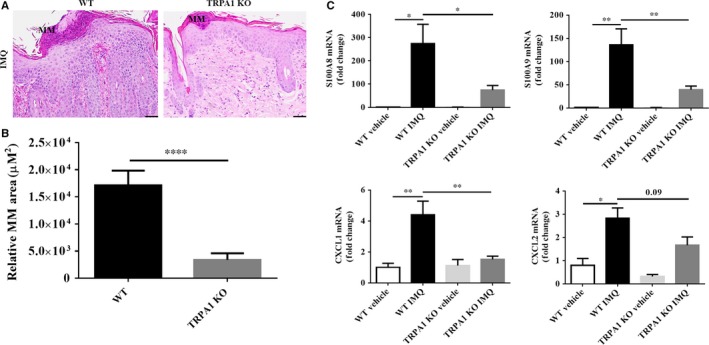
Figure 4.

TRPA1 KO mice show diminished neutrophil accumulation and neutrophil‐related cytokines levels following IMQ treatment for 5 days. (A) Representative image of MM (scale bar = 50 μm). (B) Quantification of MM area. (C) RT‐qPCR analysis of S100A8, S100A9 and CXCL1, CXCL2 (the results are normalized to GAPDH expression). n = 12 in each vehicle group, n = 20 in each IMQ group. Student’s T test was used for MM area; one‐way ANOVA followed by post‐hoc comparison (Tukey's HSD) test, for mRNA levels. Mean ± SEM values are indicated (*P < 0.05, **P < 0.01, ****P < 0.0001). IMQ, imiquimod; KO, knockout; RT‐qPCR, Real‐time‐qPCR; MM, Munro's microabscesses; TRPA1, Transient receptor potential ankyrin 1
