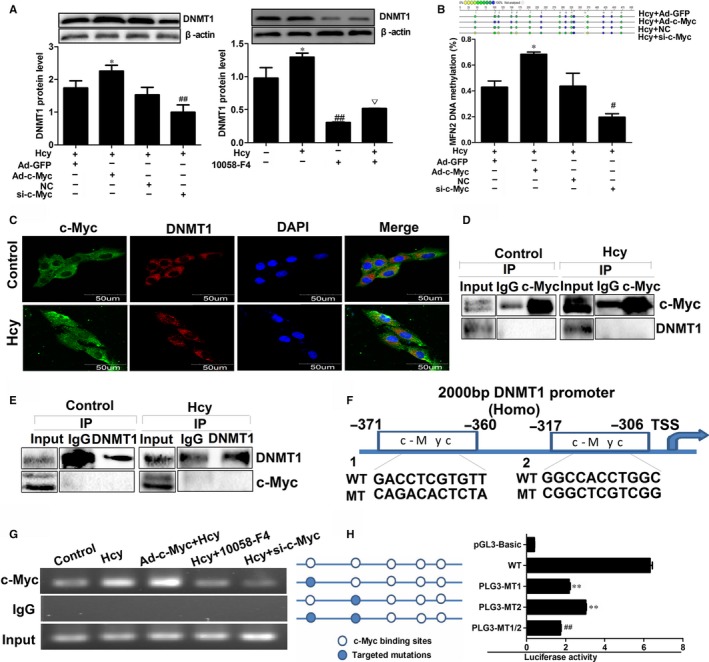
Figure 5.

c‐Myc regulates MFN2 transcription through the increased binding to DNMT1 promoter in VSMCs. A, Protein expression of DNMT1 was detected by Western blot in VSMCs with the infection of Ad‐c‐Myc and transfection of c‐Myc RNA inference vector following with 100 µmol/L Hcy treatment. B, DNA methylation level of MFN2 promoter was analysed by Mass ARRAY Quantitative Methylation after the c‐Myc overexpression or knock‐down in VSMCs. C, Co‐location of c‐Myc (green) and DNMT1 (red) in VSMCs with the treatment of Hcy were observed by laser confocal microscopy. Nuclei were stained with DAPI (blue), scale bar, 50 μm. D and E, VSMCs was treated with the Hcy and then total cell lysates of VSMCs were immunoprecipitated with c‐Myc or DNMT1 antibodies or control IgG. Co‐IP samples were analysed by Western blot with the indicated antibodies. F, A schematic diagram of potential c‐Myc binding element (two possible binding sites) in the promoter region of the DNMT1 gene predicted by Jaspar database. G, ChIP assay was performed to assess the c‐Myc binding to MFN2 promoter region in VSMCs with the infection of Ad‐c‐Myc and transfection of RNA inference vector following with 100 μmol/L Hcy treatment. The ChIP‐enriched DNA fragments of MFN2 promoter using IgG and anti‐c‐Myc antibody were amplified by PCR. Total input (5%) was used as a positive control. H, Sequential deletion and substitution mutation analyses identified c‐Myc‐responsive regions in the DNMT1 proximal promoter region, the relative luciferase activities of DNMT1 promoter were detected after solely or serially mutated c‐Myc binding sites at DNMT1 promoter region by luciferase reporter assay. **P < 0.01, compared with the WT group, ##P < 0.01, compared with pLG3‐MT1 or pLG3‐MT2 group. *P < 0.05, **P < 0.01, compared to Hcy+Ad‐GFP group. #P < 0.05, ##P < 0.01, compared to the Hcy + NC group. ▽P < 0.05, compared to the 10058‐F4 group
