
Fig. 1. EMT phenotype and in vitro functional characteristics of systemic cancer cells in the 4T1 MBC mouse model.
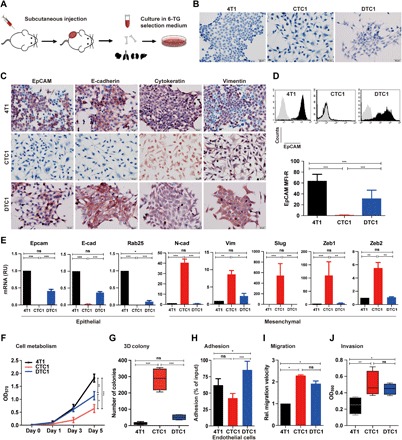
(A) Schematic representation of the experimental setup. 4T1 cells were subcutaneously transplanted in the flank of BALB/c mice. After 2 to 4 weeks, mice were sacrificed, and primary tumor, blood, bone, and organs were harvested for further culture. 4T1 tumor sublines were recovered in 6-TG–containing selection medium. (B) Morphology of 4T1, CTC1, and DTC1 lines after syngeneic transplantation and recovery from the blood (CTC1) and bone marrow (DTC1). Shown are representative pictures of each cell line. (C). IHC staining of EpCAM, E-cadherin, cytokeratin, and vimentin in 4T1, CTC1, and DTC1. Shown are representative pictures from n = 3 independent experiments. (D) EpCAM expression in 4T1, CTC1, and DTC1 was determined by flow cytometry. Top: Representative histograms with EpCAM staining in black and controls in gray. Quantification of EpCAM expression on 4T1, CTC1, and DTC1 is presented as the mean fluorescence intensity ratio (MFI-R; with SD) from n ≥ 5 independent experiments performed in unicates. One-way analysis of variance (ANOVA) with post hoc multiple testing and Bonferroni correction, ***P < 0.001. (E) mRNA transcript levels of epithelial markers, Epcam, E-cadherin (E-cad), and Rab25, and of EMT markers, N-cadherin (N-cad), vimentin, Slug, and Zeb1/2, in 4T1, CTC1, and DTC1 were assessed upon quantitative reverse transcription polymerase chain reaction with specific primers and Gusp as a house-keeping gene. Shown are means ± SD from n = 3 independent experiments performed in triplicates. One-way ANOVA with post hoc multiple testing and Bonferroni correction, *P < 0.05, **P < 0.01, and ***P < 0.001. ns, not significant; RU, relative units. (F) Cell metabolism of 4T1, CTC1, and DTC1 was assessed by MTT (3-(4,5-Dimethylthiazol-2-yl)-2,5-diphenyltetrazolium bromidefor) assay (initial cell number, 1000 cells). Shown are means with SD from n ≥ 3 independent experiments performed in triplicates. One-way ANOVA with post hoc multiple testing and Bonferroni correction, *P < 0.05, **P < 0.01, and ***P < 0.001. OD570, optical density at 570 nm. (G) 3D colony formation assay was performed with 4T1, CTC1, and DTC1 cells. Numbers of colonies are shown as boxplot whiskers graph with means from n = 4 independent experiments performed in unicates. One-way ANOVA with post hoc multiple testing and Bonferroni correction, ***P < 0.001. (H) Adhesion of 4T1, CTC1, and DTC1 cells to bEnd.3 endothelial cells was assessed. Shown are mean adhesion rate with SD from n ≥ 3 independent experiments performed in triplicates. One-way ANOVA with post hoc multiple testing and Bonferroni correction, *P < 0.05 and ***P < 0.001. (I) Migration capacity of 4T1, CTC1, and DTC1 was assessed in a scratch assay. Migration velocity is given as means (micrometers per hour) with SD from n = 3 independent experiments performed in unicates. One-way ANOVA with post hoc multiple testing and Bonferroni correction, *P < 0.05. Rel., relative. (J) The invasion capacity of 4T1, CTC1, and DTC1 cells was assessed by Transwell invasion assay. Shown are mean optical density (OD) at 590 nm quantifications of invaded cells as boxplot whiskers graph with SD from n = 3 independent experiments performed in duplicates. One-way ANOVA with post hoc multiple testing and Bonferroni correction, *P < 0.05 and **P < 0.01.