
Fig. 3. Metastasis formation of 4T1, CTC1, DTC1, and CTC sublines of DTC1-transplanted animals.
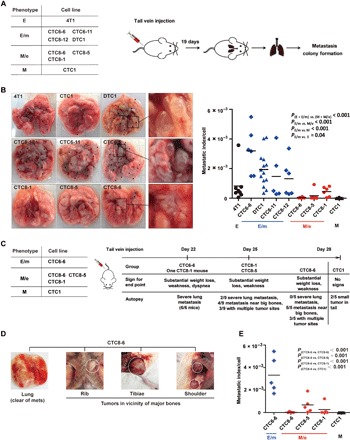
(A) Scheme of syngeneic intravenous injections: E-type (4T1, n = 8 mice), E/m-type (CTC6-6, n = 6 mice; CTC6-11, n = 5 mice; CTC8-12, n = 6 mice; DTC1, n = 14 mice), M/e-type (CTC8-6, n = 6 mice; CTC8-5, n = 6 mice; CTC8-1, n = 6 mice), and M-type (CTC1, n = 8 mice) cells (5 × 10⁴) were transplanted into BALB/c mice through the tail vein. After 19 days, numbers of superficial lung metastasis were counted, and lungs were harvested for further metastasis colony formation assay. (B) Left: Representative pictures of lungs following intravenous injection of cells bearing different EMT phenotypes. Black dots indicate metastatic lung nodules. Right: Dot plot shows metastatic index per cell including means (line) and P values for each cell line after intravenous injection. One-way ANOVA with post hoc multiple testing and Bonferroni correction; P values are indicated. (C) Scheme of syngeneic intravenous injections: E/m-type (CTC6-6), M/e-type (CTC8-6, CTC8-5, and CTC8-1), and M-type (CTC1) cells were transplanted into BALB/c mice through tail vein injection. Each experimental group was ended at the day of the indicated signs for end point. Results from autopsy at the given time points are described. (D) Pictures of autopsy results from CTC8-6–injected mice displaying the lack of lung metastasis and the presence of tumors in the vicinity of the rib, tibiae, and shoulder blade. (E) Dot plot shows metastatic index per cell of E/m-type (CTC6-6), M/e-type (CTC8-6, CTC8-5, CTC8-1), and M-type (CTC1) cells including mean values (line). One-way ANOVA with post hoc multiple testing and Bonferroni correction; P values are indicated. Photo credit: X. Liu (University of Munich).