
Fig. 4. EpCAM expression profiles correlate with an epithelial phenotype of experimental cells and human CTCs.
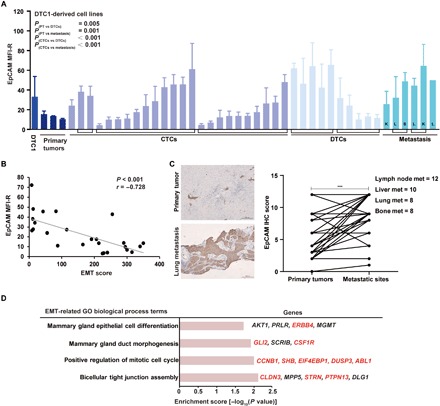
(A) EpCAM expression was measured by flow cytometry in cell lines from primary tumors (PT), CTCs, DTCs, and metastases isolated from DTC1-injected BALB/c mice. Brackets demark cell lines originating from one individual mouse. L, lung; S, spleen; K, kidney. Data are presented as mean fluorescence intensity ratios (EpCAM/iso) with SD from n ≥ 3 independent experiments performed in unicates. One-way ANOVA with post hoc multiple testing and Bonferroni correction; P values are indicated. (B) Cluster plot analysis of Spearman’s rank correlation between EpCAM expression and EMT score in DTC1-derived CTC sublines. Correlation coefficient (r) and P value are included. (C) EpCAM expression level was assessed in n = 38 human breast tumors and associated lymph node metastases (met) (n = 12), liver metastases (n = 10), lung metastases (n = 8), and bone metastases (n = 8). Shown are representative IHC staining of EpCAM in primary tumors and corresponding lung metastasis and quantifications of IHC intensity scores for all samples as paired samples (see Materials and Methods). Paired t test, ***P < 0.001. (D) Enrichment analysis of GO biological process terms of genes extracted from CNVs of EpCAM+ (n = 10) versus EpCAM− CTCs (n = 20) from patients suffering from MBC (n = 3). GO terms related to epithelial differentiation are listed. Enrichment score with −log10 (P value) of more than 1.3 was considered significant. Gene names in red font: amplified in EpCAM+ CTCs; gene names in black font: mutated in EpCAM+ or EpCAM− CTCs.