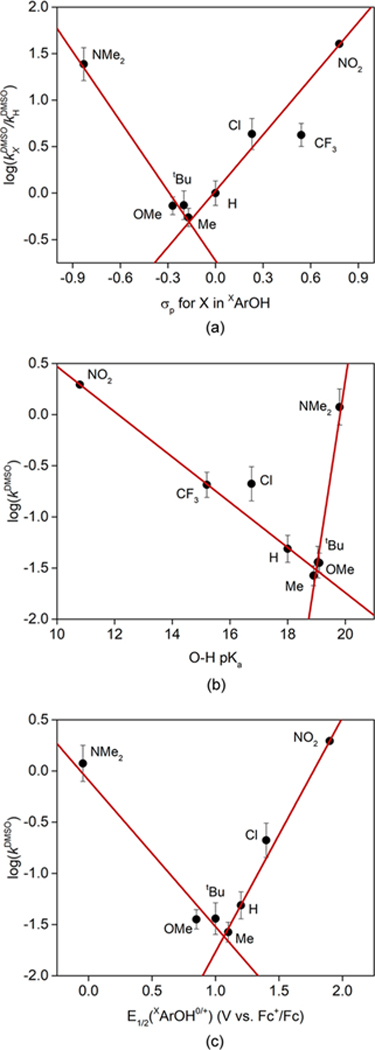
Figure 5.

(a) Hammett plot of log(kXDMSO/kHDMSO) versus XArOH σp, with X labeled. Separate linear fits are shown to data for X = NMe2, OMe, tBu, and Me (slope ρ = −2.5, R2 = 0.97) and for X = Me, H, Cl, CF3, and NO2 (slope ρ = +2.0, R2 = 0.96). (b) Plot of log(kDMSO) versus XArOH pKa. Separate linear fits are shown to data for X = NMe2, OMe, tBu, and Me (slope = +1.84, R2 = 0.924) and for X = Me, H, Cl, CF3, and NO2 (slope = −0.22, R2 = 0.998). (c) Plot of log(kDMSO) versus XArOH0/+ E1/2. Separate linear fits are shown to data for X = NMe2, OMe, tBu, and Me (slope = −1.43, R2 = 0.92) and for X = Me, H, Cl, and NO2 (slope = +2.29, R2 = 0.996).
