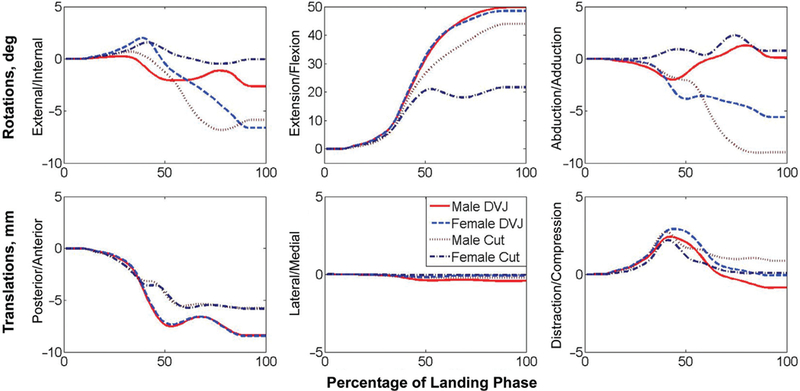
Figure 1.

Kinematic pathways for all 6 degrees of freedom for each of the 4 motions simulated. Curves represent the kinematic changes that the joint underwent from its original orientation (in vivo recorded position at initial contact) through the end of the landing phase of motion (in vivo recorded position where minimum center of gravity was achieved). For each cycle of simulation, once 100% landing phase was reached, the limb was articulated back to its starting orientation through the reverse kinematic pathway before the following cycle of motion was initiated.
