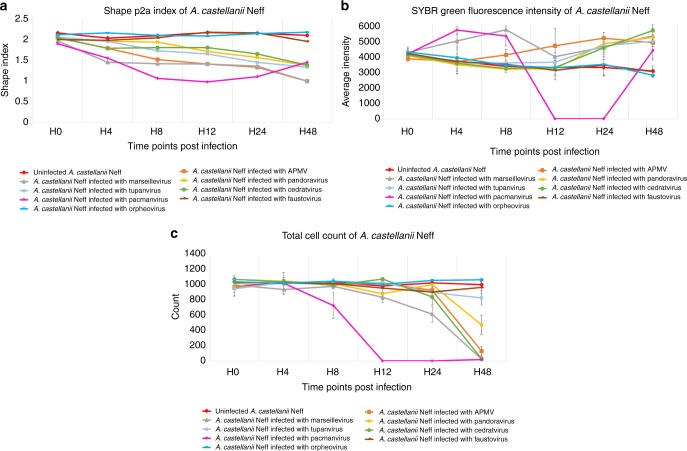
Fig. 1.
Giant virus infectivity profiles and signatures in A. castellanii Neff analyzed by high-content screening. Targeted algorithms for image analysis were configured on the negative control A. castellanii Neff stained with SYBR Green. The mean values are represented for each parameter (n = 3 independent experiments). Error bars represent standard deviations. In addition, p-values were generated for each parameter. a Cell Shape P2A Index (p-value of 0.02). b SYBR Green Average Intensity p-value of 0.008 and c total cell count (p-value of 0.005)

