Figure 1.
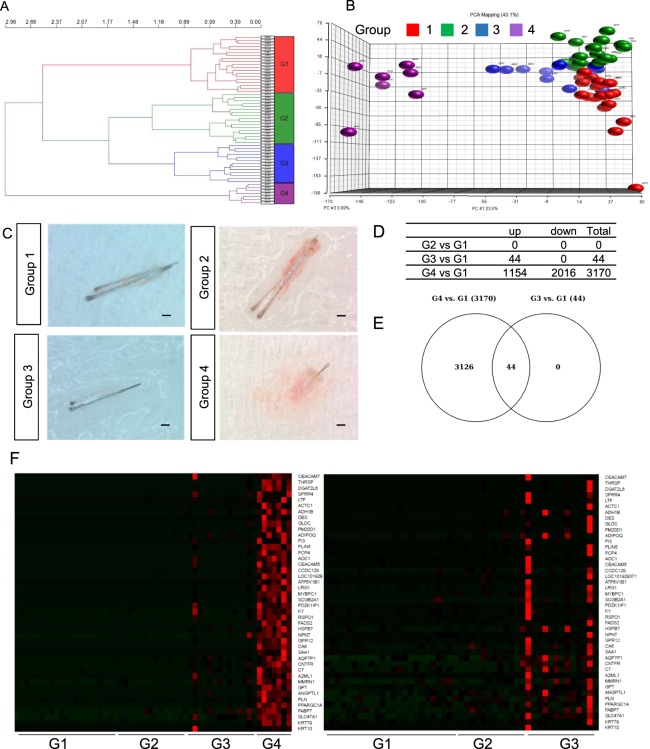
Sample clustering by transcriptome profiling implicates transition in AGA severity. (A) Principal component analysis (PCA) plot of mRNA transcriptome profile of FUE samples classified by unsupervised hierarchical clustering. (B) Hierarchical clustering of samples according to transcriptome profile. (C) Representative images of hair follicles from group 1–4. Scale: 1 mm. (D) List of differentially expressed genes between G1 vs G2, G1 vs G3 and G1 vs G4. (E) Venn Diagram of differentially expressed genes overlapping between G1 vs G2, G3 and G4. (F) Heat map representing expression of genes differentially expressed in G1 vs G3 across G1 to G3 and G1 to G4 samples. Gene expression level are represented by intensity of red color in pixels across different groups of samples.

