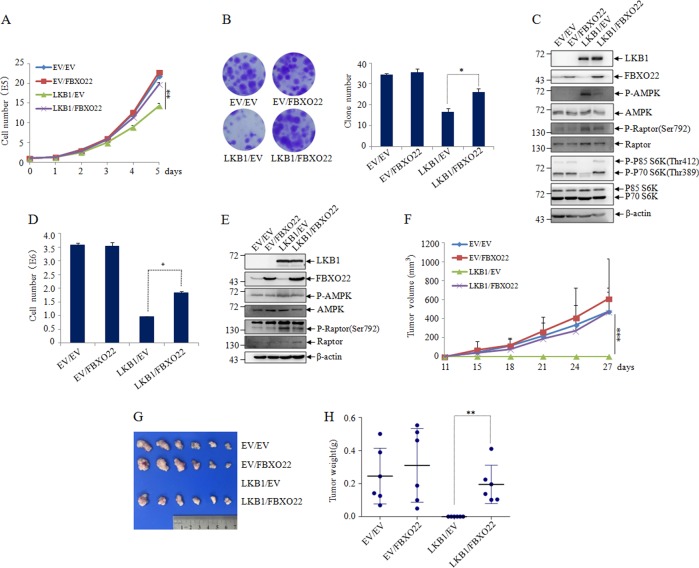
Fig. 6. FBXO22 targets LKB1 to accelerate cell growth.
a Cell counting of EV/EV, EV/FBXO22, LKB1/EV, LKB1/FBXO22 co-transfected A549 cells after 0–5 days of growth. Data are presented as mean ± S.D and significance is **P < 0.01, which was repeated for more than three times. b Colony formation capacity of cells discribed as (a) was assessed by the number of clones. Representative images were presented (left) and the number of clones was calculated for each well of six-well plates and shown (right). Data are presented as mean ± SD and significance is *P < 0.05, which was repeated for more than three times. c Cell lysates from the cells discribed as (a) were subjected to western blot to detect the indicated proteins, with β-actin as a loading control. d Cell counting of EV/EV, EV/FBXO22, LKB1/EV, LKB1/FBXO22 co-transfected H460 cells after 4 day growth (left). Data are presented as mean ± SD and significance is *P < 0.05, which was repeated for more than three times. e Cell lysates from the cells discribed as (d) were subjected to western blot to detect the indicated proteins, with β-actin as a loading control. f–h The cells discribed as (d) were subcutaneously injected into nude mice. At least six tumors per condition were analyzed. f The tumor growth curve of tumor volume was drawn according the times indicated. Data are presented as mean ± SD. and symbol *** indicates p < 0.001 between lined groups. The macroscopic appearances of tumors (g) and the tumor weight (h) were shown at one month after injection. Data are presented as mean ± SD and symbol ** indicates p < 0.01 between lined groups

