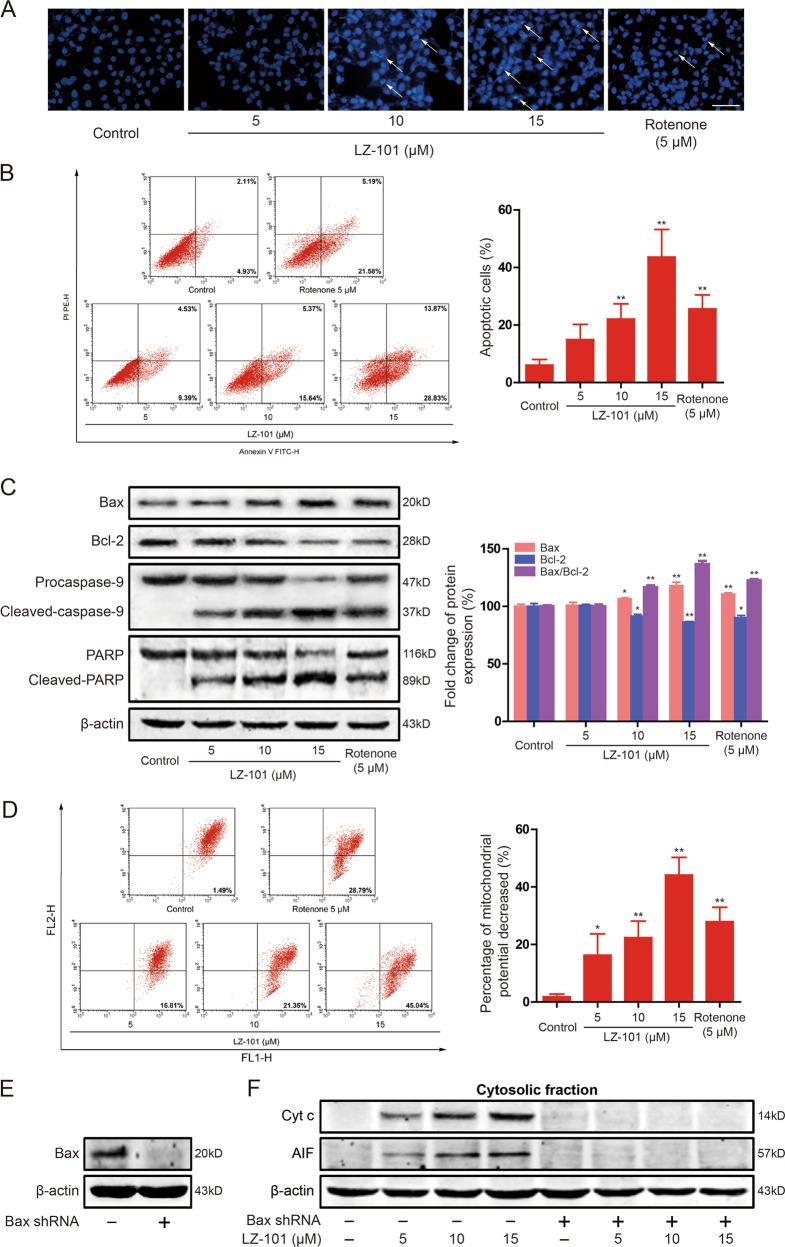
Fig. 2. LZ-101 induces mitochondrial apoptosis in A549 cells.
A549 cells were exposed to LZ-101 (5, 10, and 15 μM) or Rotenone (5 μM) for 24 h. a DAPI staining was used to detect the apoptosis. Scale bars, 50 µm. b Induction of apoptosis were measured by Annexin-V/PI double-staining assay (left). Histograms shows the distribution of apoptotic cells for three independent experiments (mean ± SD) (right). c The levels of Bax, Bcl-2, caspase-9, and PARP were assessed by western blot. Ratio of Bax/Bcl-2 expression using densitometric analysis. d The change of ΔΨm as detected by flow cytometry using JC-1 staining. e Bax were detected by western blot after transfection of Bax shRNA into A549 cells. f The release of Cyt c and AIF from mitochondria into cytoplasm was measured by Western blot assay. Data are presented as mean ± SD. *P < 0.05, **P < 0.01 compared with DMSO group

